
Figure 2: Optimization and characterization of DTX-sHDL-CpG nanodiscs.
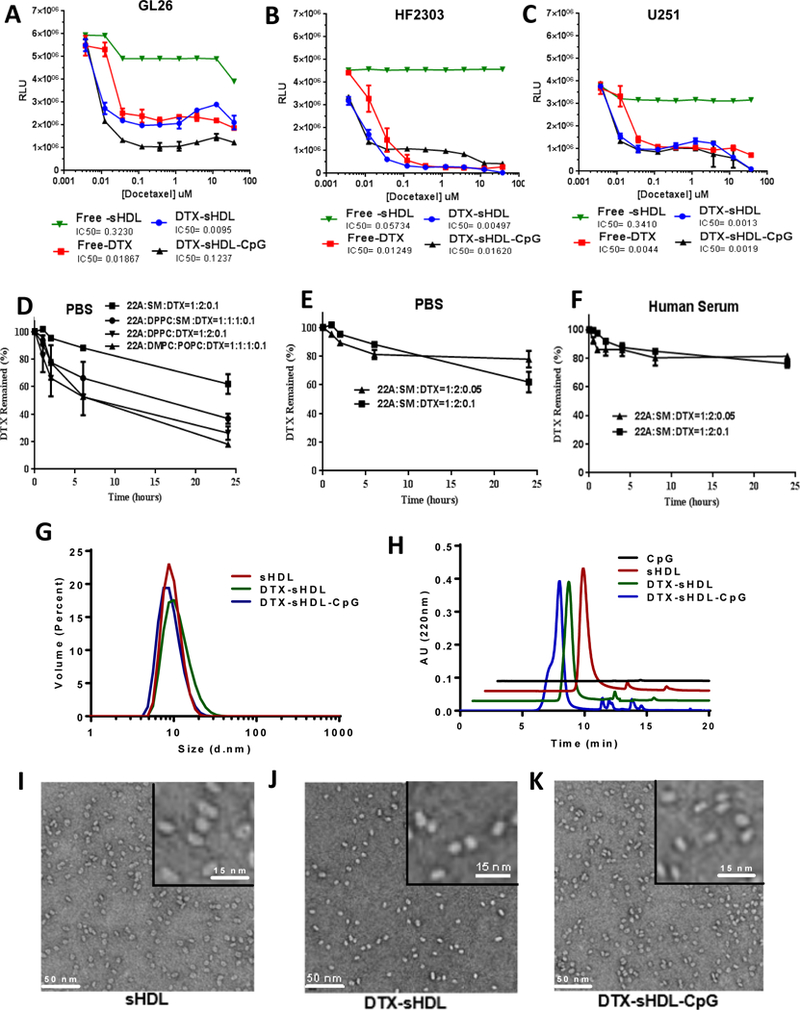
(A-C) Dose response curves for mouse (GL26, Panel A) and human (HF2303, Panel B; U251, Panel C) glioma cells treated with free-DTX; HDLs loaded with DTX; HDLs conjugated with CpG and loaded with DTX; or empty HDLs of equivalent HDL concentration to the chemotherapeutic loaded-HDLs. Cells were incubated with sHDL nanodiscs for 48 hours at indicated doses, then cell viability was evaluated. Bars represent ± SEM corresponding to three technical replicates. (D) Measurement of DTX-sHDL nanodiscs’ stability in PBS. (E) Measurement of DTX-sHDL nanodiscs’ stability with high (3.2%) or low (1.6%) drug loading in PBS. (F) Measurement of DTX-sHDL nanodiscs’ stability with high (3.2%) or low (1.6%) drug loading in human serum. For collecting stability measurements, various formulations of DTX-sHDL were suspended in PBS or human serum and incubated at 37°C with the DTX concentration of 1 mg/ml and sHDL concentration of 10 mg/mL. At different time points, 100 μl mixture of each sample was collected and filtered. The amount of drug that remained in the particles was determined by UPLC analysis. (G-H) Particle size distribution of blank sHDL, DTX-sHDL, and DTX-sHDL-CpG determined by dynamic light scattering (DLS, Panel D) and gel permeation chromatography (GPC, Panel E) at sHDL concentration of 1mg/mL. (I-K) Images demonstrating particle size distribution and morphology of blank sHDL (I), DTX-sHDL (J) and DTX-sHDL-CpG (K) taken by transmission electron microscopy (Scale bar illustration for low magnification = 50nm). Higher magnification images are shown in the upper right corner for each formulation (scale bar =15nm).