
Figure 6: Chemo-immunotherapy induces tumor-specific CD8 T cell responses within GBM TME.
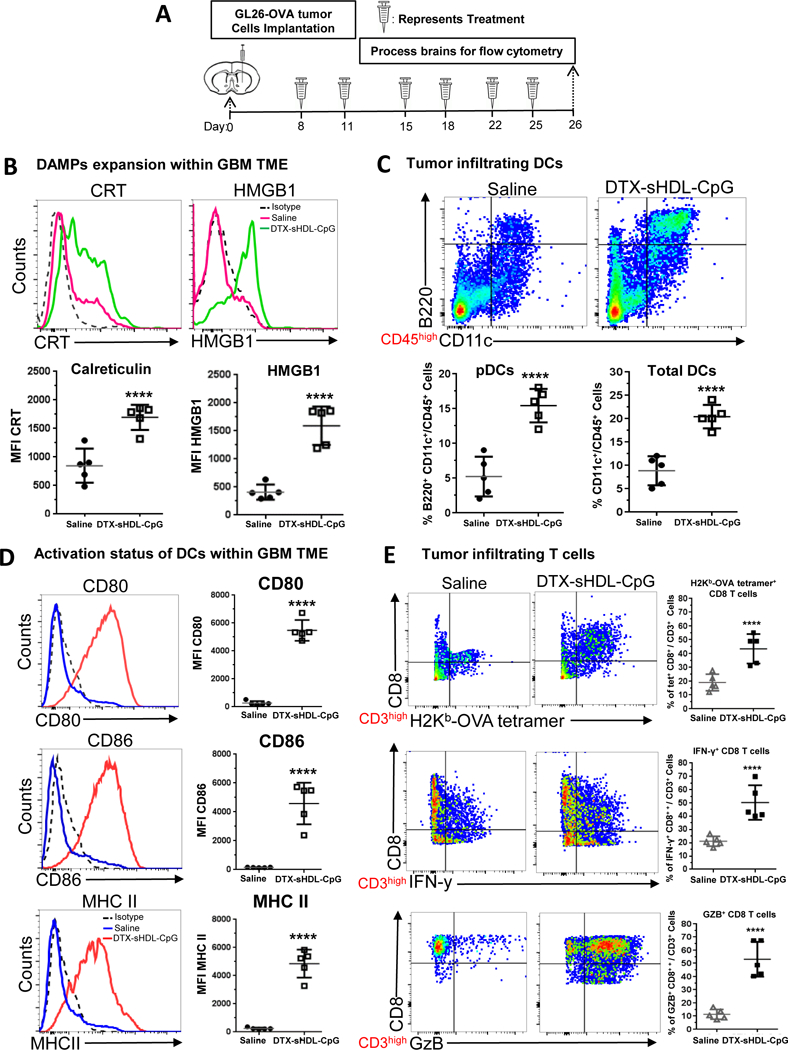
(A) Mice bearing GL26-OVA tumors were treated with sHDL-CpG-DTX nanodiscs or saline (n=5 mice /treatment group) at 8, 11, 15, 18, 22 and 25 days post tumor implantation (dpi), at end of the treatment brains were harvested for flowcytometry analysis. Levels of ICD markers, CRT (B) and HMGBI, within saline and DTX-sHDL-CpG TME of GL26 tumor-bearing were determined at 26 dpi. Representative histograms display each marker’s expression levels (solid lines: pink= saline, green= DTX-sHDL-CpG) compared to isotype controls (black dotted line). MFI= mean fluorescence intensity. ****p < 0.0001; unpaired t-test. Bars represent mean ± SEM (n= 5 biological replicates). (C) The percent of pDCs (CD11c+/B220+) and pan DCs (CD11c+) within the CD45+ cell population in the TME of saline and sHDL-CpG-DTX treated mice was assessed at 26dpi. Representative flow plots for each group are displayed. ****p < 0.0001; unpaired t-test. Bars represent mean ± SEM (n= 5 biological replicates). (D) Activation status of CD11c+ DCs in the tumor was compared between saline and sHDL-CpG-DTX treatment groups at 26dpi. Activation status of DCs was assessed by the expression levels of CD80, CD86, and MHC II. Representative histograms display each marker’s expression levels (solid lines: blue= saline, red= DTX-sHDL-CpG) compared to isotype control (black dotted line). ****p < 0.0001; unpaired t-test. Bars represent mean ± SEM (n= 5 biological replicates). (E) Tumor-specific CD8+ T cells within the TME of GL26-OVA tumors were analyzed by staining for the SIINFEKL-Kb tetramer. Activation status of CD8+ T cells within the TME was analyzed by staining for granzyme B (Gzb) and IFNγ after stimulation with the tumor lysate. Representative flow plots for each group are displayed. ****p < 0.0001; unpaired t-test. Bars represent mean ± SEM (n= 5 biological replicates).