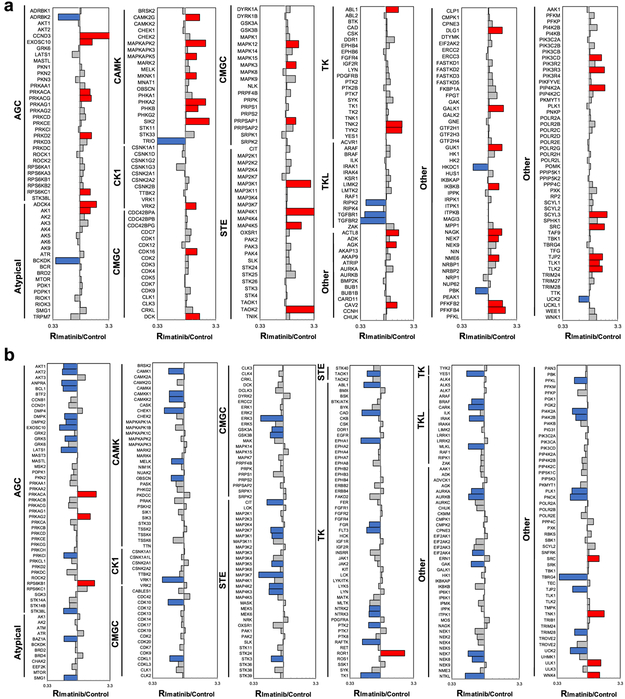
Figure 2.
Differential protein expression (a) and ATP-binding affinities (b) of kinase proteins in K-562 cells induced by imatinib treatment. The kinase protein expression data represent the mean of results obtained from three forward and two reverse SILAC labeling experiments, and the ATP-binding affinity results reflect five forward and six reverse ATP probe labeling experiments. (The ratios obtained from individual measurements are listed in Table S2.) Blue, red, and gray bars represent those kinases with ratios (in imatinib-treated/control cells) that are <0.67, >1.5, and between 0.67 and 1.5, respectively.

