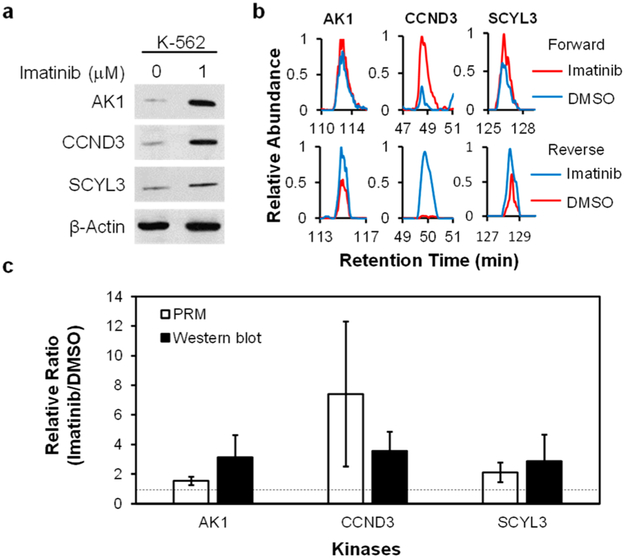
Figure 3.
Western blot analyses for validating the protein expression levels of kinases in K-562 cells with or without imatinib treatment. (a) Images from Western blot analyses of the expression levels of select kinases in K-562 cells with or without imatinib treatment. (b) Representative PRM traces for monitoring the expression levels of the same kinases as shown in (a). (c) The quantification results for the ratios of kinase proteins in imatinib-treated cells over untreated cells. Error bars represent standard deviations.

