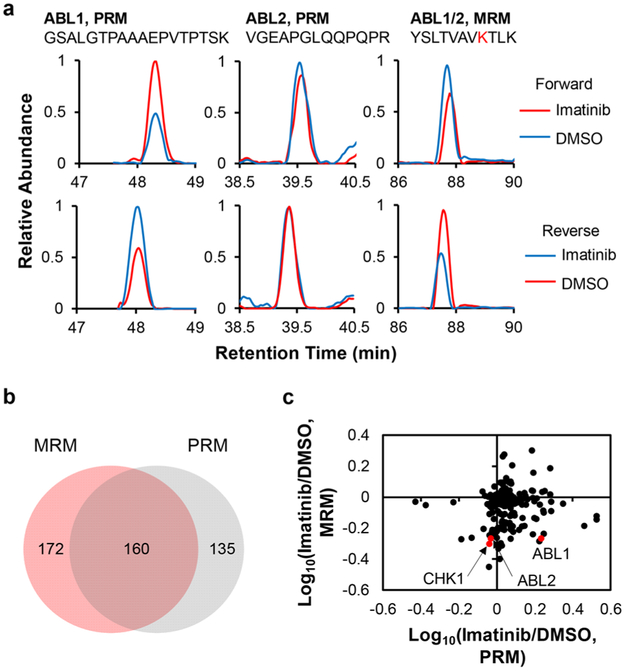
Figure 4.
PRM and MRM results showing the differential expression and ATP-binding affinities of kinases in K-562 cells induced by imatinib treatment. (a) Representative PRM and MRM traces for the quantification of ABL kinases. (b) Venn diagram depicting the overlap in the numbers of kinases that were quantified by the PRM- and MRM-based kinome profiling methods for lysates of K-562 cells after a 24 h treatment with 1 μM of imatinib or DMSO. (c) A scatter plot depicting the lack of correlation between the ratios of kinases in imatinib-treated cells over control DMSO-treated cells obtained from the PRM and MRM methods (plotted in logarithm scale).

