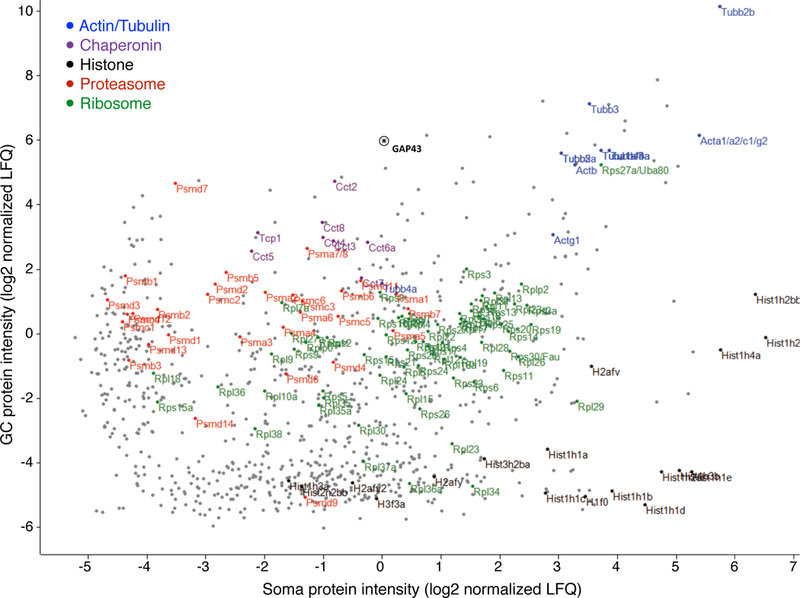
Extended Data Figure 3. Sorted GC-soma protein mass-spec intensities.

Scatter plot of paired protein intensities from trans-hemispheric sorted GC and sorted parent somata. Units represent log2 peak-normalized intensities as measured by MaxLFQ. Gene groups are highlighted as indicated in the key. The GC marker GAP43 is indicated by an asterisk.
