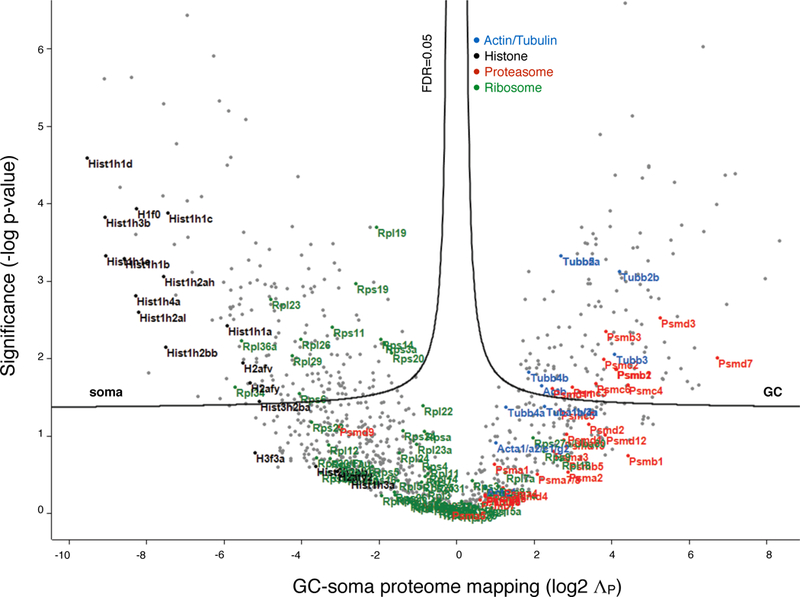
Extended Data Figure 5. Sorted GC-soma protein polarization.

Volcano plot of GC-soma proteome mapping, with ΛP (log2) for each gene product plotted against significance (−log P-value). FDR of 0.05 indicates statistical thresholds for soma- and GC-specific mapping. Highlighted gene groups indicated in key. The proteome of sensorimotor cortex inter-hemispheric projection neurons distributes between cellular compartments with varying polarization that clusters with gene group, including GC-rich clusters (e.g. proteasome), soma-rich clusters (e.g. histones), and groups with moderate levels present in both GCs and somata with moderate enrichments for one or the other compartment (e.g. ribosomes, and actins / tubulins).
