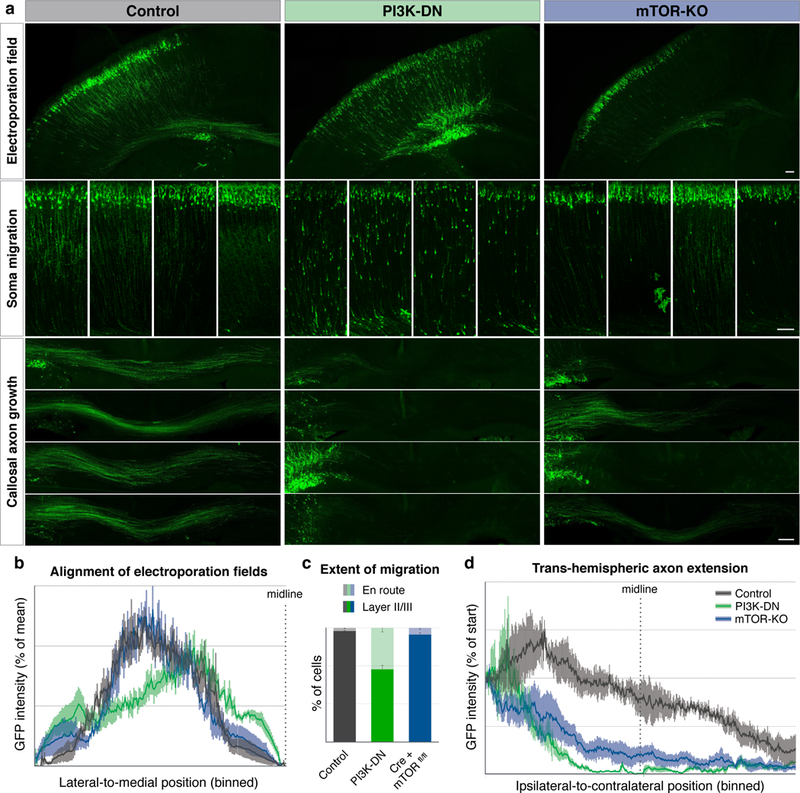
Figure 6. mTOR signaling is required for the extension of trans-hemispheric axons.

a, Electroporation of callosal projection neurons with GFP and genetic payloads at E15, fixation and analysis at P3. Control electroporations (left column, grey in quantifications) show soma migration into upper layers (middle row insets, examples from four brains), and callosal projections well into the contralateral cortex (bottom insets, examples from four brains). Electroporation with dominant negative PI3 kinase expression construct (PI3K-DN, middle column, green in quantifications) results in hindered migration of somata, and failure of callosal axon growth. Electroporation of Cre expression construct in mice with homozygous floxed-mTOR alleles for conditional mTOR gene deletion (right column, Cre + mTORfl/fl, blue in quantifications) resultes specifically in failure of callosal axon growth. Scale bars indicate 100 µm. b, Quantification of the location of the electroporation field shows comparable mediolateral electroporation positions across all samples. Plotted are histograms of binned GFP intensities along the tangential axis of the ipsilateral cortex ending at the midline. c, Quantification of extent of migration, with percentage of somata in layers II/III (dark colors) vs. somata still en route in deeper layers (light colors). Inhibiting PI3K signaling (green) interferes with migration, while acute mTOR deletion (blue) does not significantly affect migration. d, Quantification of callosal axon extension showing that PI3K inhibition (green) as well as knockout of mTOR (blue) disrupt the formation of axon projection across the corpus callosum. Plotted are binned GFP intensity histograms within the corpus callosum from ipsilateral, through the midline (indicated dotted line) to contralateral side. All error bars show SEM, n=4 mice.
