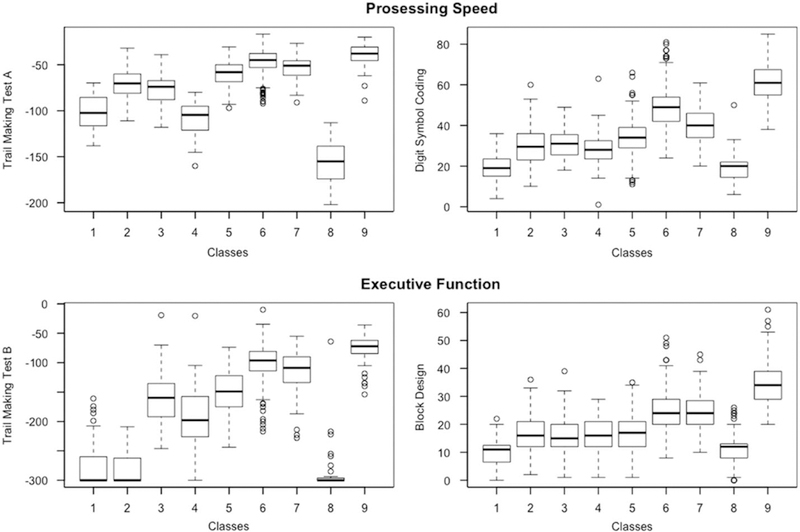
Fig. 2.

Boxplots illustrating how each of the classes performed on cognitive measures reflecting domains of Processing Speed and Executive Function. Note. Class 1= the disadvantaged class; Class 2 =poor language; Class 3= poor episodic memory and fluency; Class 4= poor processing speed and executive function; Class 5 =low average cognition; Class 6 =high average cognition; Class 7 =average cognition; Class 8=poor executive and poor working memory; Class 9= elite.
