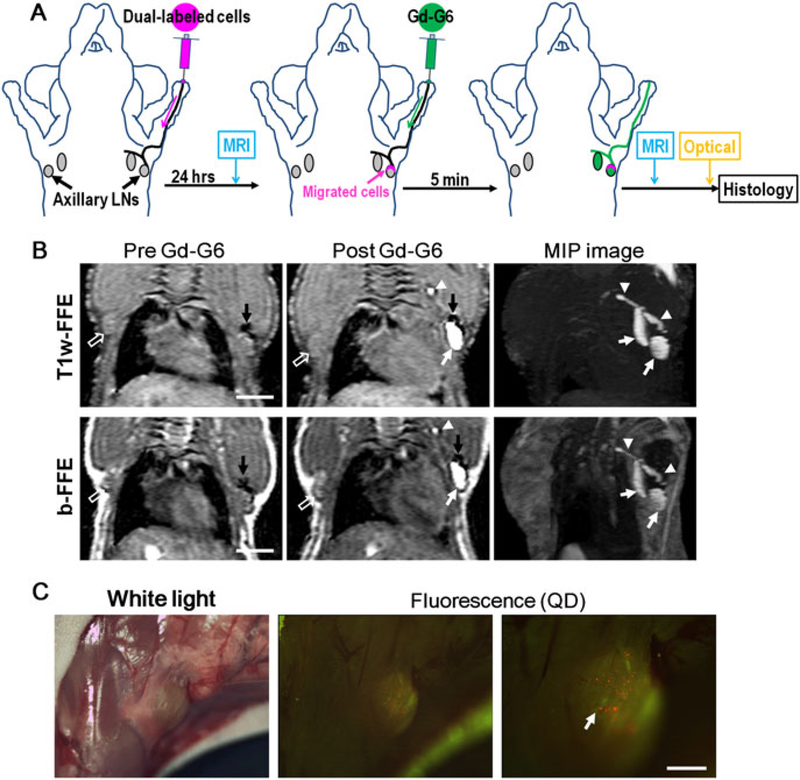
Figure 2.
Intralymphatic cancer cell tracking with MR and optical imaging in vivo. (A) Schematic illustration of the protocol. (B) Both T1-weighted-gradient echo sequence (T1w-FFE) and balanced-steady-state free precession (b-FFE) images show iron-labeled cancer cells in the periphery of the left axillary lymph node (dark areas, black arrows). After administration of Gd-G6 MR contrast agents into the left paw, the cancer cells and lymphatic basin are simultaneously depicted (lymph nodes: white arrows, lymphatic ducts: arrow heads), while no enhancements (neither negative nor positive) are observed in the contralateral axillary lymph node (open arrows). MIP, maximum intensity projection. Scales in images are 5 mm. (C) In vivo fluorescence images show optically labeled cancer cells (small red dots, arrow) in an axillary lymph node with high spatial resolution. Note that the green fluorescence arises from autofluorescence in the background tissue. Scale in fluorescence image is 1 mm. These cancer cells can be observed in real time (see video in Supporting Information).

