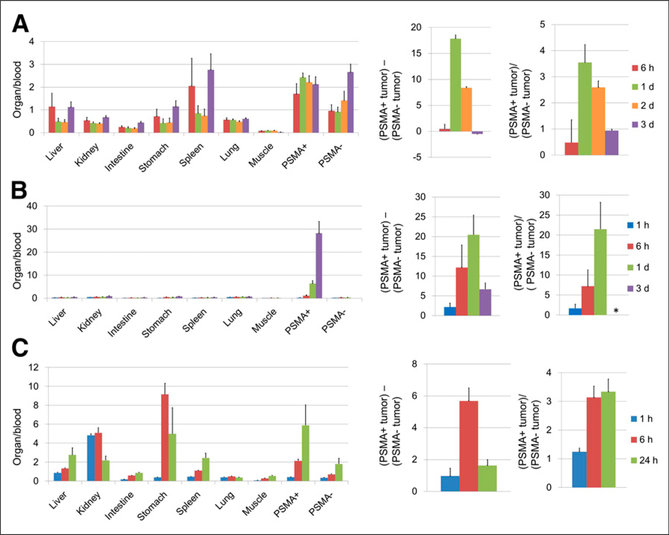
FIGURE 3.
Analysis of in vivo biodistribution of radioactivity after injection of 125I-PSMA-IgG (A), Mb (B), or Db (C) into mice bearing PSMA positive (PSMA1) and negative (PSMA−) tumors. Each value was calculated using percentage injected dose per gram of tissue (Supplemental Fig. 1) for each animal and represented as mean ± SEM (n = 3–5): ratios of each organ and tumor to blood (left), subtraction of PSMA-negative tumor from PSMA-positive tumor (center), and ratios of PSMA-positive tumor to PSMA-negative tumor (right). * = value cannot be calculated because some denominators are 0.

