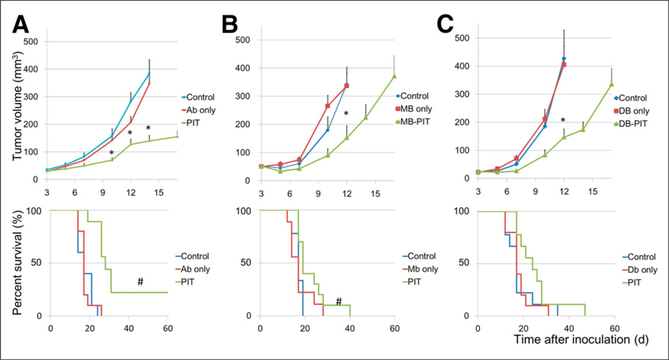
FIGURE 4.
Tumor volume and survival curves of PSMA-positive tumor-bearing mice. Mice were randomized to 1 of 3 groups at 3 d after tumor cell injection (n = 9–10). IgG-IR700 (A), Mb-IR700 (B), or Db-IR700 (C) was injected, and photoimmunotherapy was performed at 1 and 2 d after injection for IgG-IR700 or Mb-IR700 and at 6 h and 1 d after injection of Db-IR700. Mice were observed until tumor volume reached more than 500 mm3, at which time mice had to be euthanized. *P < 0.05 vs. control, Dunnett multiple-comparison test. #P < 0.05 vs. control, log-rank test. Ab = antibody.

