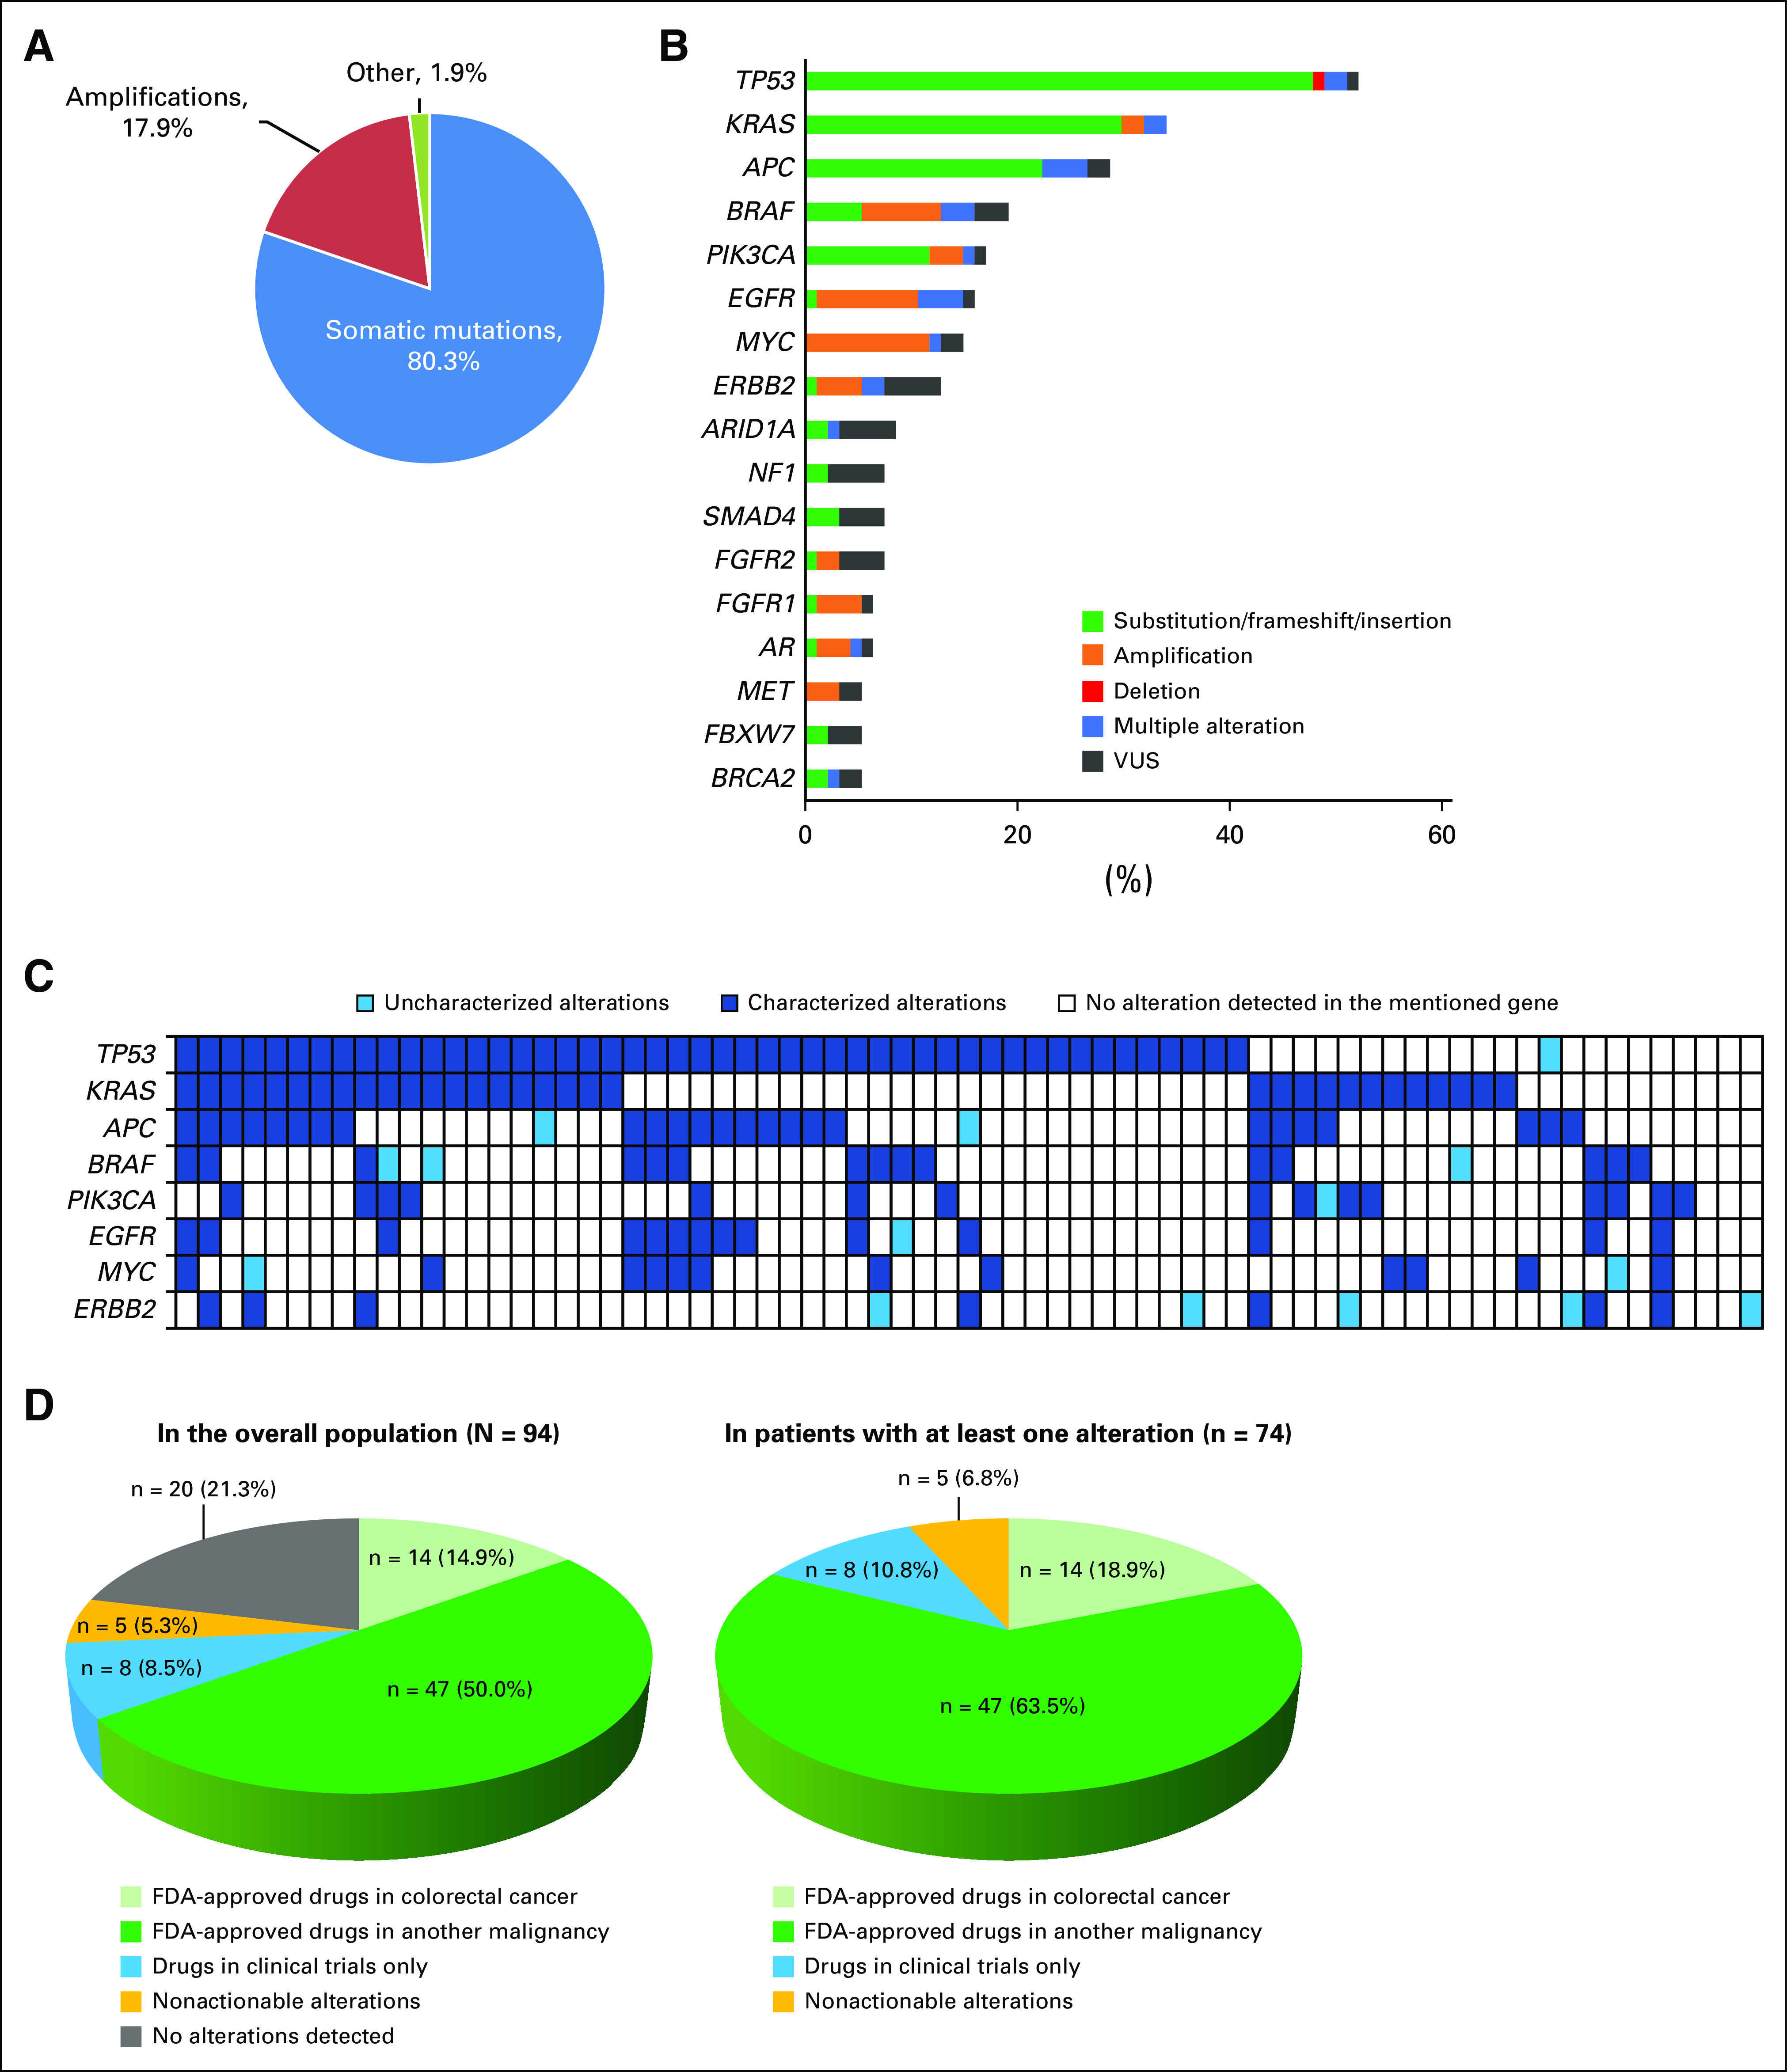
Fig 1.

(A) Pie chart showing the types of alterations in the overall population (N = 94). In total, 375 nonsynonymous alterations were detected in 94 patients (74 patients had at least one alteration). Other alterations included three deletions, three insertions, and one fusion.. Frequencies are percent of alterations. (B) Frequency of the most common circulating tumor DNA (ctDNA) alterations. Only genes that were altered in five or more patients are displayed in the bar graph. The other altered genes in our population (fewer than five patients had the alteration) were ABL1, AKT1, ALK, ARAF, ATM, BRCA1, CCND1, CCND2, CCNE1, CDH1, CDK6, CDKN2A, CTNNB1, ESR1, FGFR3, GNAQ, GNAS, HRAS, JAK3, KIT, MAP2K1, MLH1, MTOR, NOTCH1, NRAS, PTEN, RAF1, RB1, RET, RHOA, RIT1, ROS1, SDK6, SMO, STK11, VHL. This analysis included only nonsynonymous alterations. Alterations of unknown significance (variant of unknown significance; VUSs) versus characterized mutations (indels, amplifications, fusions, and single nucleotide variant (SNV) point mutations) were considered at the variant level. Multiple alteration indicates that different alterations were found in same gene (eg, alterations in both BRAF amplification and SNVs found in same patient). Frequencies are percent of patients. (C) Oncoprint of the most frequent alterations. Only alterations identified in more than 10 patients were represented. Each row represents the mentioned alteration; each column represents one patient. Only patients with at least one alteration in one of these genes—TP53, KRAS, APC, BRAF, PIK3CA, EGFR, MYC, or ERBB2—are displayed (n = 71 patients; the other 23 patients had no alterations in the represented genes and their corresponding columns would have been empty or white). (D) Pie charts representing the potential actionability of the detected alterations in the overall population (N = 94; left) and in patients with at least one nonsynonymous alteration (n = 74; right). Percentages are percent of patients. FDA, US Food and Drug Administration.
