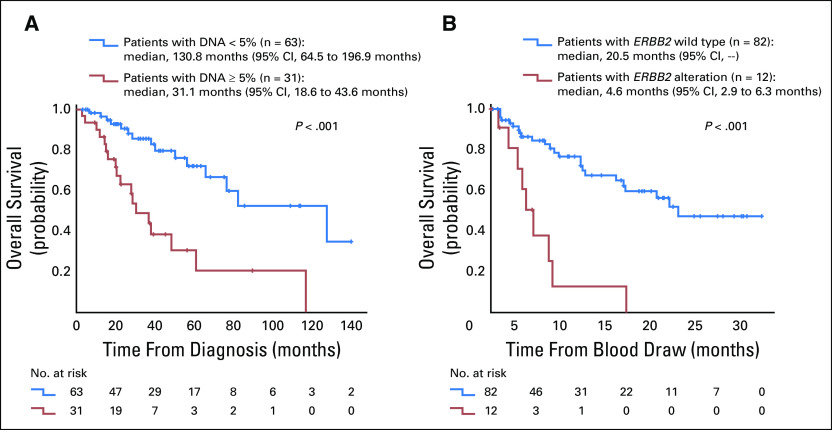
Fig 2.
Kaplan-Meier curves for overall survival analysis from (A) the time of diagnosis and (B) the time of blood draw used for the ctDNA testing. The variables that were significant in the multivariable analyses (Table 2) are represented. P values are from the log-rank test.

