Figure 1.
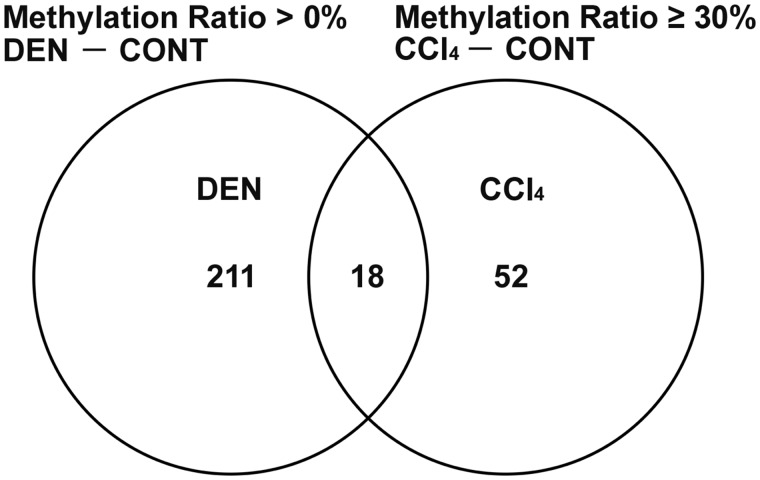
Venn diagram denoting 52 genes located at promoter region of gene sequence showing hypermethylation (methylation ratio ≥ 30%) and transcript downregulation specific to CCl4 group in comparison with untreated controls, after excluding hypermethylated (methylation ratio > 0%) and downregulated genes in DEN group compared with untreated controls in Experiment 1.

