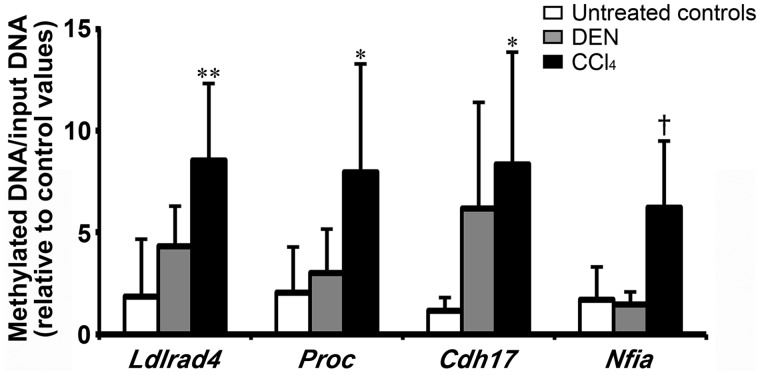
Figure 2.
Methylation-specific quantitative PCR data of selected 4 genes hypermethylated and downregulated specific to CCl4 group in the liver on day 28 in Experiment 1. Values represent mean + SD (n = 5). *p < .05, **p < .01, significantly different from untreated controls by Dunnett’s or Steel’s test. †p < .05, significantly different from untreated controls by Student’s or Aspin-Welch’s t test.

