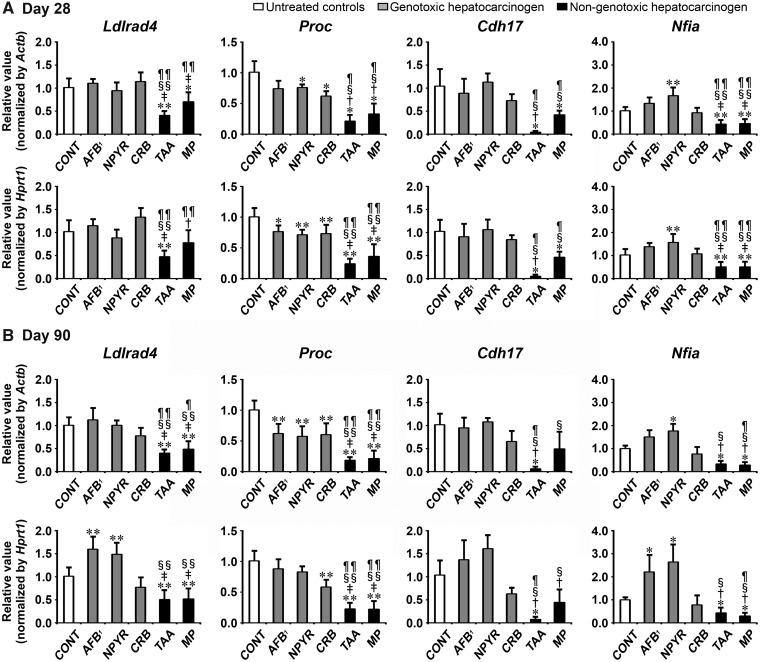
Figure 4.
Data of real-time RT-PCR analysis of selected genes to examine specificity to nongenotoxic hepatocarcinogens in Experiment 2. A, Day 28. B, Day 90. Values are normalized to Actb or Hprt1 and expressed as the mean + SD (n = 6). *p < .05, **p < .01, significantly different from untreated controls by Tukey’s or Steel-Dwass test. †p < .05, ‡p < .01, significantly different from AFB1 group by Tukey’s or Steel-Dwass test. §p < .05, §§p < .01, significantly different from NPYR group by Tukey’s or Steel-Dwass test. ¶p < .05, ¶¶p < .01, significantly different from CRB group by Tukey’s or Steel-Dwass test.

