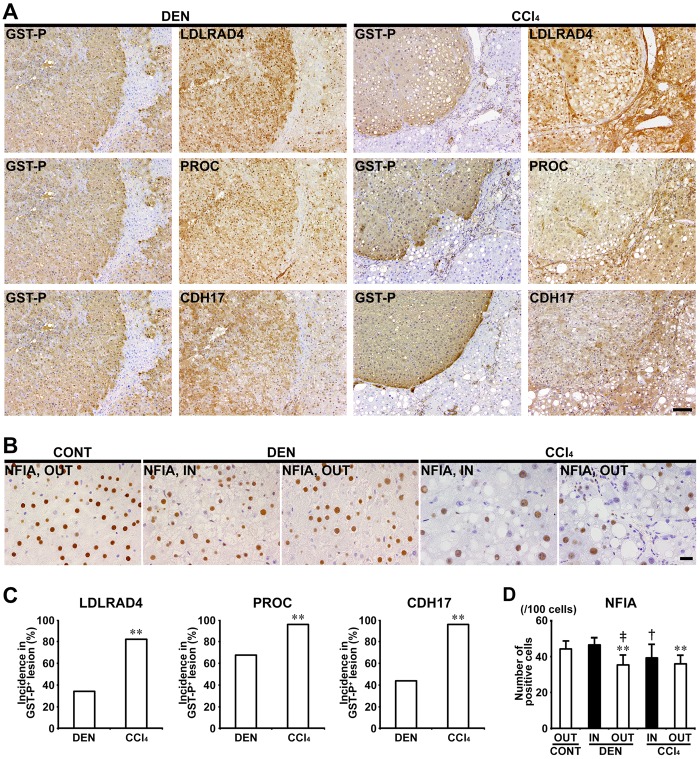
Figure 5.
Immunohistochemical cellular distribution of LDLRAD4, PROC, CDH17, and NFIA in association with GST-P+ liver cell foci after treatment with DEN or CCl4 for 84 days in Experiment 1. A, Expression of LDLRAD4, PROC and CDH17 in GST-P+ foci in DEN and CCl4 groups (×10 objective). Bar = 100 µm. B, Expression of NFIA of inside (IN) or outside (OUT) of GST-P+ foci (×40 objective). Bar = 20 µm. C, Incidences of LDLRAD4−, PROC−, and CDH17− foci in GST-P+ foci in DEN and CCl4 groups. Graphs show incidences (% value, mean + SD, n = 10) of negative foci of each molecule in GST-P+ foci in each group. **p < .01, significantly different from DEN group by Fisher’s exact test. D, Number of NFIA+ cells in IN or OUT of GST-P+ foci in DEN and CCl4 groups. Graph shows the number of NFIA+ cells (/100 cells) (value, mean + SD) IN or OUT of GST-P+ foci in each group. **p < .01, significantly different from OUT of untreated controls by Tukey’s or Steel-Dwass test. †p < .05, ‡p < .01, significantly different from IN of GST-P+ foci in DEN group by Tukey’s or Steel-Dwass test.

