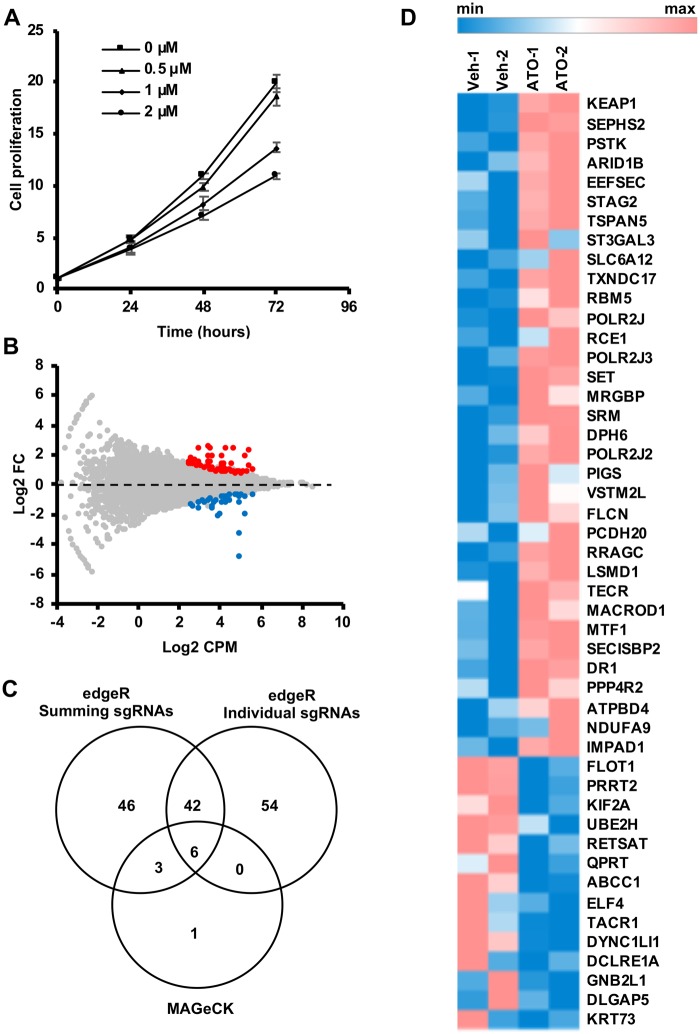
Figure 2.
Identification of multiple candidate genes affecting ATO/AsIII toxicity. A, Cytotoxicity of multiple concentrations of ATO in K562 cells evaluated at 24, 48, and 72 h by CellTiter Glo cell proliferation assay. Data are represented as mean ± SD (n = 3). B, Scatter plot showing relative enrichment (log2 FC > 0) or depletion (Log2 FC < 0) of each gene-specific guide sequence in ATO compared to vehicle control (Veh). Log2 fold changes (FC) are plotted against the average abundance of each guide sequence in the pool represented as Log2 counts per million (CPM). Hits with FDR values < 0.1 are shown in different colors. C, Venn diagram showing unique and common candidates identified by 3 analysis methods. For each method, number of hits with FDR < 0.1 is shown. D, Heatmap of the normalized sum of counts of all guide sequences targeting each gene. Only hits that are in common between the summing and individual sgRNA analysis approaches are shown. The screen was run in duplicate and the values corresponding to each replicate (Veh or ATO) are represented in the heat map.

