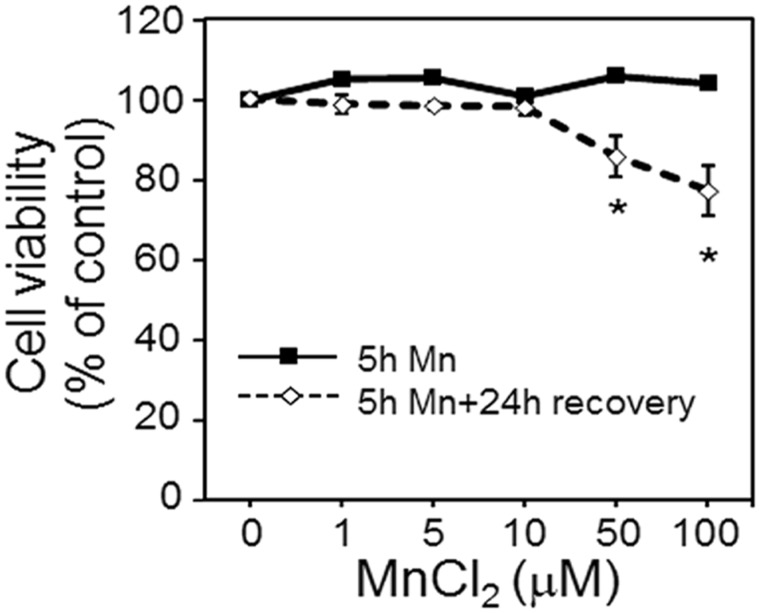
Figure 1.
Cell viability at 5 h Mn treatment and 24 h post recovery. Viability of cells treated with 0, 1, 5, 10, 50, and 100 μM Mn concentration for 5 h is represented by the solid black line. At the end of 5 h, media including Mn was removed, cells washed 3 times and fresh growth media was added. Cell viability determined after 24 h recovery period is depicted by the dotted line. Data are expressed as the percentage of viable cells compared with no Mn treatment (mean ± SEM, n = 3 per treatment group).

