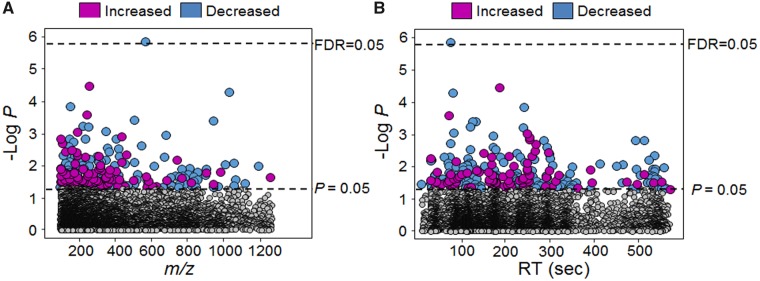
Figure 2.
Metabolome-wide association study (MWAS) of dose-dependent cellular Mn in human SH-SY5Y cells. A, Type 1 Manhattan plot depicted by –log P against m/z (mass to charge) is plotted showing 283 discriminatory metabolites at p-value .05 threshold represented by bottom dotted line and at FDR 0.05 represented by top dotted line. B, Type 2 Manhattan plot depicted by –log P against RT (retention time, sec). Magenta circles represent features that were increased and the blue circles represent the features that were decreased with increasing cellular Mn accumulation. The list of m/z and RT along with p-value for the entire 283 metabolites is provided in Supplementary Table 1 (n = 9 per treatment group).

