Figure 4.
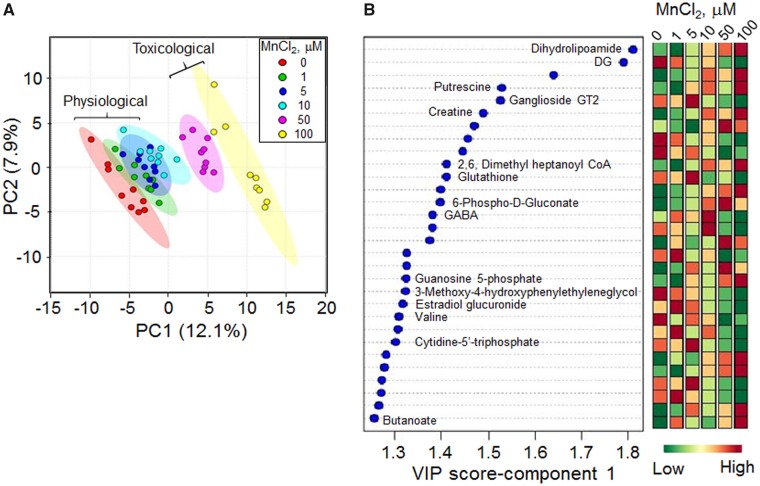
PLS-DA and the resultant top 30 discriminatory metabolic features contributing to the Mn dose-dependent separation. A, PLS-DA score plot for high-resolution metabolomics data resulting in a Mn dose-dependent separation is along principal component 1 (PC1–12.1%). B, The top 30 discriminatory metabolic features contributing to the separation listed from top to bottom is shown with their VIP scores (variable importance in projection scores) and changes in intensity at each Mn dose. The metabolite associated with the m/z features is marked as determined by Kegg ID.

