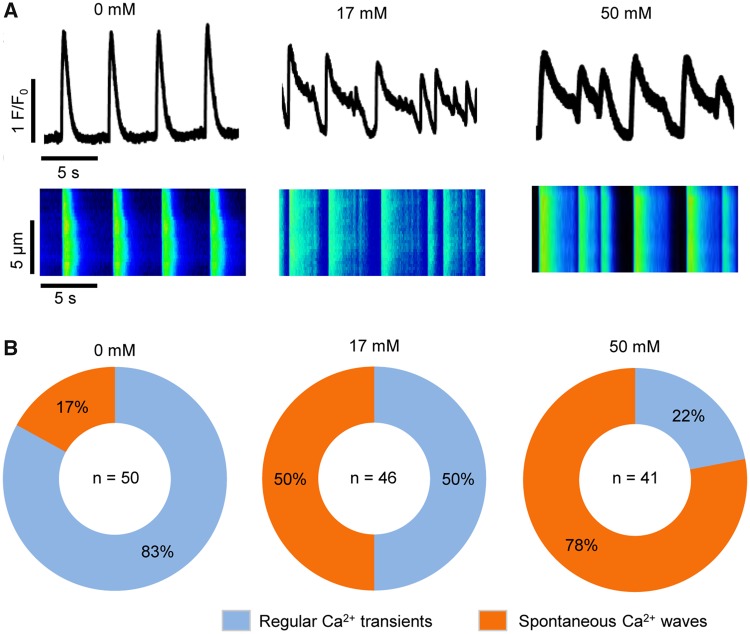
Figure 4.
Ethanol exposure of hiPSC-CMs alters intracellular Ca2+ handling. A, Representative confocal images showing cytosolic calcium traces and line-scan of intercellular Ca2+ transients in cells from control (0 mM ethanol) and the treatment groups (17 and 50 mM ethanol). B, Pie chart showing the percentage of cells exhibiting regular Ca2+ transients or Ca2+ transients with spontaneous Ca2+ waves (SCWs) under each condition. Sample sizes (n) are denoted in the center of the graphs for the control and treatment groups.

