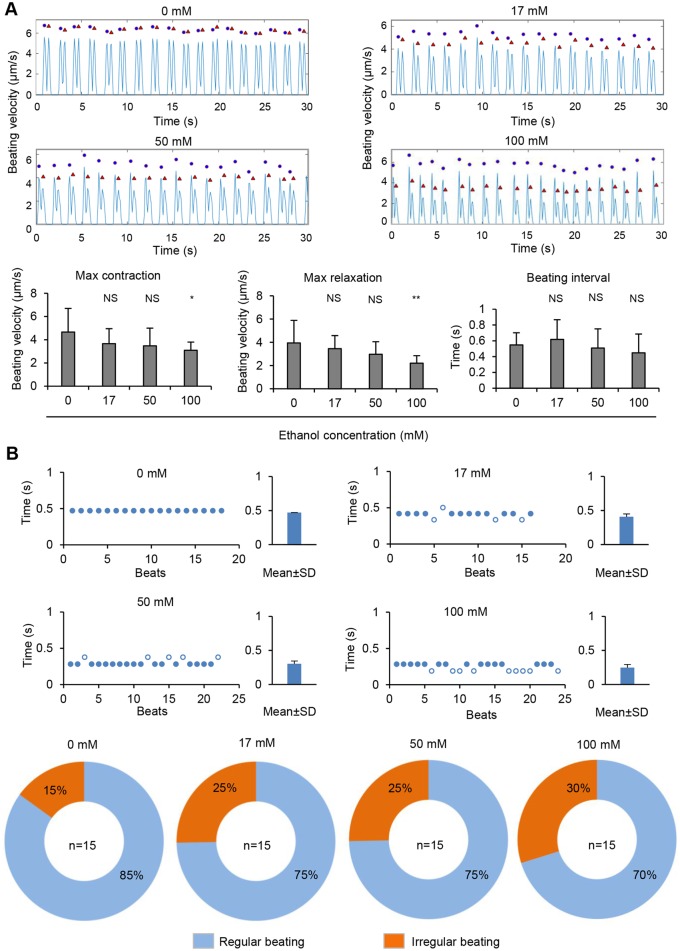
Figure 5.
Ethanol exposure of hiPSC-CMs alters cells contractility. A, Video-based analysis of contractility. Representative traces show beating velocity recording of cardiomyocytes under each condition. Dots denote contraction, and triangles denote relaxation. Contraction parameters are presented as mean±SD of n = 15 biological samples. NS, no significant difference compared with control (0 mM). *p-value < .05; **p-value < .01. B, Scatter charts show representative traces of beating for hiPSC-CMs under each condition. The irregular beating (hollow dots) are those with beating period larger than mean+SD of beat to beat time or smaller than mean – SD of beat to beat time. Bar graphs of beating periods are presented as mean±SD of beat to beat time. Pie chart showing the percentage of cells with regular beating or irregular beating under each condition. Sample sizes (n) are denoted in the center of the graphs for the control and treatment groups.

