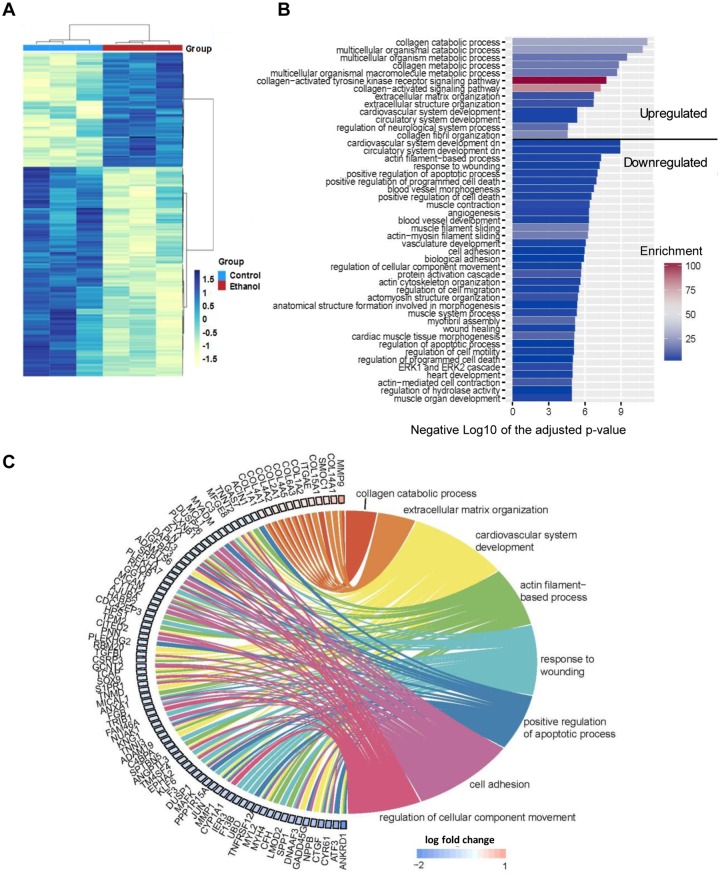
Figure 6.
Differentially expressed genes and gene ontology (GO) terms identified by RNA-seq analysis of hiPSC-CMs upon treatment with ethanol. A, Heatmap of differentially expressed genes between control and ethanol-treated hiPSC-CMs (n = 3). B, GO results bar plot. The GO terms are summarized using REVIGO. Length of bar indicates the gene enrichment score and color of bar is –log10 (p-value). C, Chord diagram showing the relationship between interested GO clusters and corresponding differentially expressed genes. In each chord diagram, enriched GO terms were presented on the right, and genes contributing to these enrichments were drawn on the left. Colored squares on the left are indicated LFC value and ordered from highest to lowest LFC.

