Figure 1.
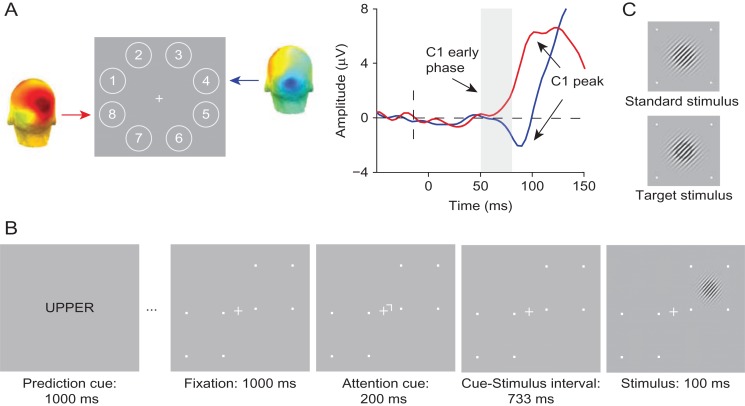
Experimental tasks and stimuli of Experiment 1. (A) In the probe session, stimuli were presented at eight locations around fixation to determine two diagonally opposite locations at which stimuli elicited a robust C1 for a given individual (numbers only shown for display purposes). For a representative subject, shown are the corresponding C1 topographies for an upper location (Location 4) and a lower location (Location 8) averaged over the 50–80 ms post-stimulus period. On the right, the corresponding ERP waveforms are shown. As depicted in the figure, stimuli presented at the upper location elicited a C1 of negative polarity (blue line), whereas stimuli presented at lower location elicited a C1 of positive polarity (red line). (B) The spatial cuing task used in the experimental sessions. Each block of the task started with a prediction cue (the word “UPPER”, “LOWER”, or “NEUTRAL”), which signaled the likely location of a stimulus in the upcoming block of 20 trials with 75% (upper or lower cue) or 50% (neutral cue) validity. In each trial, a spatial cue instructed participants to covertly direct their attention to the cued location, which was followed after a fixed delay, by a stimulus, a Gabor patch, at either the cued (attended), or the non-cued (unattended) location. Participants were asked to press a left mouse button if they detected a target, which could only appear at the cued location. Target stimuli appeared on 25% trials and were Gabor patches with a black ring superimposed. The trial sequence shown above is an example of a trial in which a non-target stimulus appears at the location that is both more likely (predicted) and relevant (attended). (C) Standard and target stimuli used in Experiment 1.

