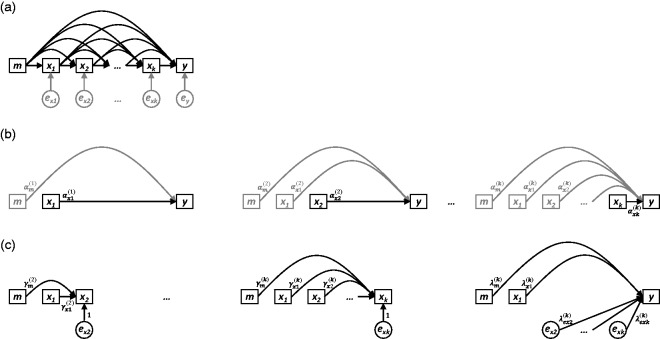
Figure 2.
(a) Nonparametric causal diagram (DAG) representing the hypothesised data-generating process for k longitudinal measurements of exposure x (i.e. x1,x2,…,xk), one distal outcome y , and one time-invariant confounder m . The terms em, ex1,…,exk and ey represent all unexplained causes of m, x1,…,xk, and y, respectively, and are included to explicitly reflect uncertainty in all endogenous nodes (whether modelled or not).(b) Path diagrams depicting the k standard regression models that would be constructed to estimate the total causal effect of each of x1,x2,…,xk on y (i.e. equation (9)). For each model, only the final coefficient may be interpreted as a total causal effect; all other coefficients are greyed to illustrate that no such interpretation should be made for them. (c) Path diagrams depicting the UR model, consisting of k − 1 preparation regressions (i.e. equation (10)) and a final composite regression model (i.e. equation (11), with i = k ).

