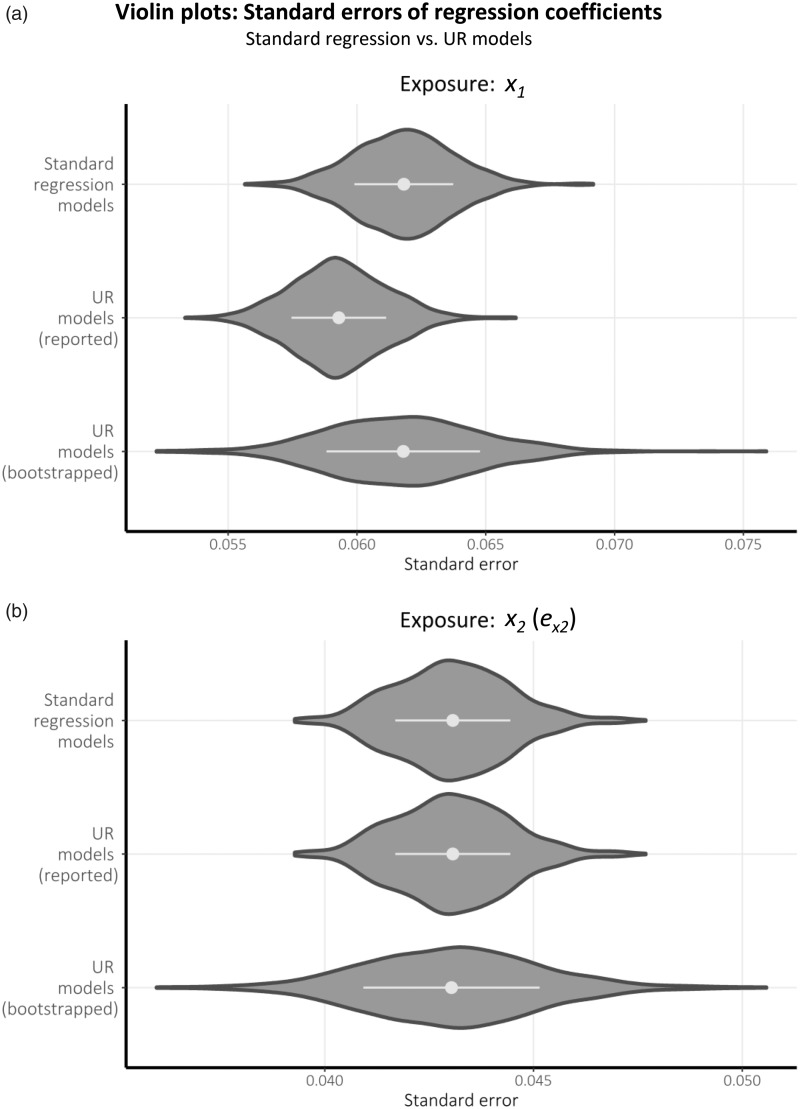
Figure 4.
Violin plots comparing the standard errors associated with equivalent coefficients estimated in standard regression vs. UR models, for data simulated based upon the scenario depicted in Figure 1(a) (with k = 2). Horizontal bars within each distribution represent the mean ± 1 standard deviation.

