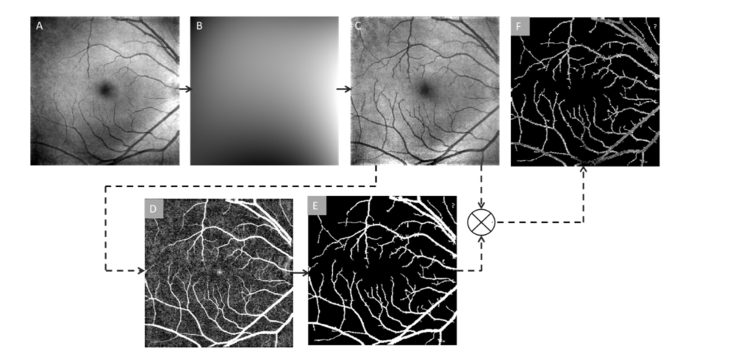
Fig. 2.
OCT normalization and vessel segmentation. (A) Original en face OCT image. (B) Bias field estimation generated from the original en face OCT image. (C) Normalized intensity after bias field correction. (D) Edge enhanced using bottom hat filtering. (E) Binary vessel mask. (F) Segmented vessel map by multiplying images C and E.

