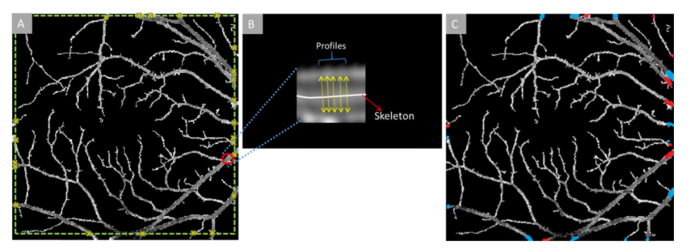
Fig. 3.
(A) En face OCT vessel map with source nodes identified with yellow crosses. (B) An enlarged sample source node segment (marked with red circle in (A)). Sample profiles (marked with yellow arrows) are extracted from each segment like this for further feature extraction and artery-vein classification. (C) En face OCT vessel map with identified source nodes as artery (red) or vein (blue).

