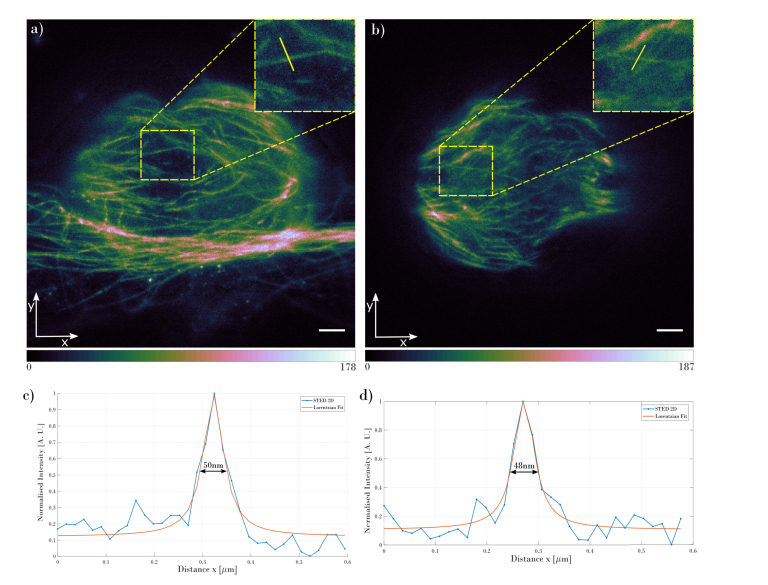
Fig. 3.
Slices of the mitotic spindle acquired with the 2D STED mode at different depths measured from the bottom of the cell: (a) 1µm from the bottom and (b) 10µm from the bottom. Insets in the images show the zoomed area marked with the yellow dashed rectangle. Plots in (c) and (d) show the intensity cross-sections for the microtubules, at the position marked with the yellow line inside the insets. The scale bar on both images are 1µm.

