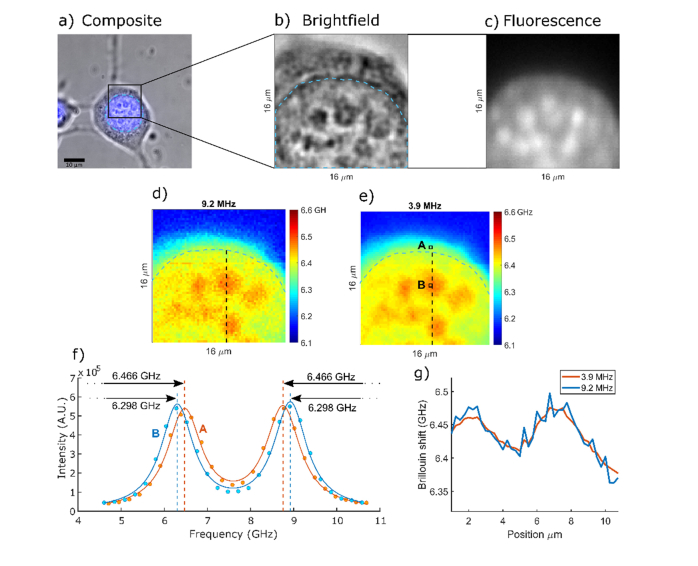
Fig. 3.
a) Brightfield and nuclear fluorescence composite image of a 3T3 cell attached on glass. b) Zoomed in region of the nucleus with clearly visible nucleoli. c) Spinning disk fluorescence image of the same region of the cell. d) Horizontal Brillouin shift confocal slice of a cell imaged with 9.2 MHz shift precision and 20 ms exposure time per pixel. d) Same horizontal Brillouin shift confocal slice imaged with 3.9 MHz shift precision and 180 ms exposure time per pixel. Dashed blue line indicates the location of the nucleus edge. f) Example Brillouin spectra acquired (dots) and their respective Lorentzian best fit lines (solid lines) in two locations A and B denoted in e). g) Line profile of the Brillouin images at two different precision levels. Location of the line profile is indicated by the black dashed line in the Brillouin maps in d) and e).

