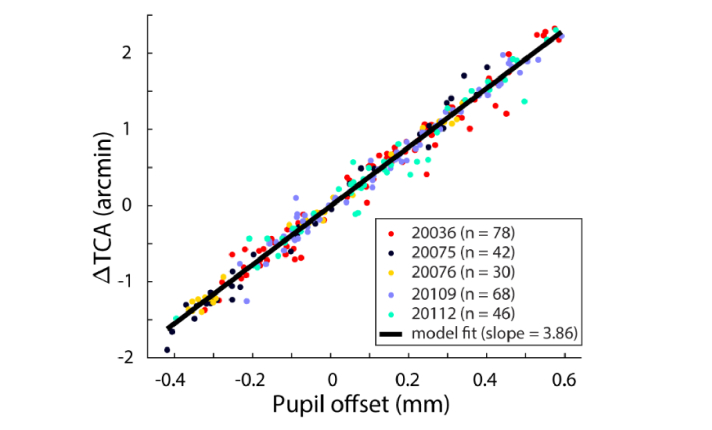
Fig. 4.
Image-based estimates of TCA at offsets relative to the pupil reference. Each data point represents the average TCA offset across 30 video frames plotted against the pupil offset relative to the reference position. Each subjects’ data (represented here by different colored circles) were individually fit to Eq. (1) and scaled so that ΔTCA, the change in TCA relative to its value at the reference, was zero at the reference pupil position (pupil offset = 0 mm). The combined data were then fit to Eq. (2) (solid black line).

