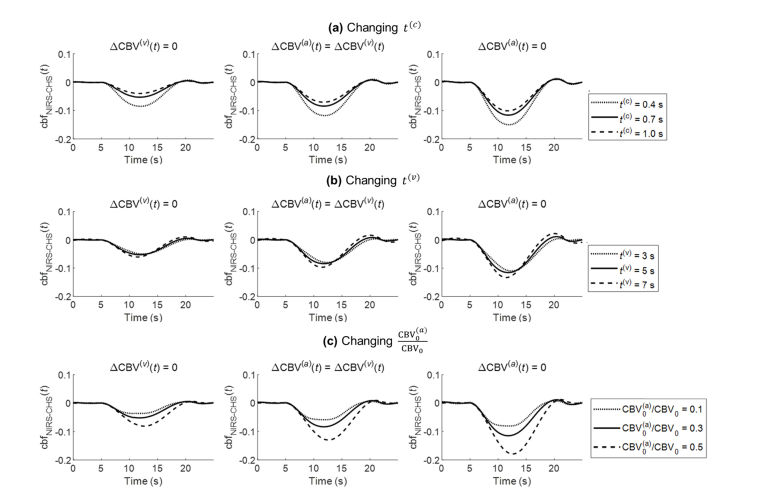
Fig. 4.
Sensitivity of cbfNIRS-CHS(t) to (a) capillary transit time (t(c)), (b) venous transit time (t(v)), and (c) the arterial baseline cerebral blood volume ratio For each panel, three conditions are illustrated left to right for the relative arterial-to-venous blood volume dynamics: arterial only (), equally venous and arterial (), and venous only (). The cbf(t) traces indicated by solid lines in the middle plots for (a)-(c) are the same with the cbf(t) trace in Fig. 3(b).

