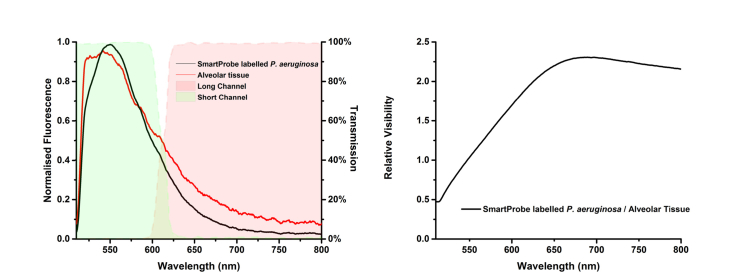
Fig. 2.
(left) Example fluorescence emission of SmartProbe labelled P. aeruginosa (black) and human lung (red) at excitation of 470 nm at 5.5 µW acquired using a spectrometer (USB2000 + VIS-NIR-ES, Ocean Optics) coupled into a spectroscopy setup analogous to our imaging arrangement. SmartProbe labelled bacteria have greater short wavelength contributions than typical lung tissue autofluorescence. Profile of dichroic mirrors used to separate the short and long channels determines the short channel wavelength range (green fill) and the long channel wavelength range (red fill). (right) Relative visibility of SmartProbe labelled bacteria defined as the relative spectral ratio value of SmartProbe labelled bacteria to lung tissue for a range of potential cut-off wavelengths.

