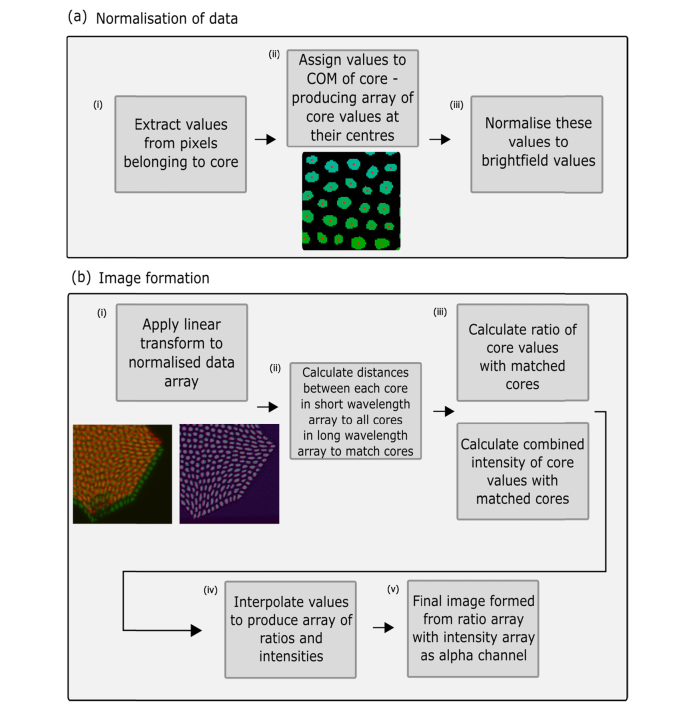
Fig. 4.
Schematic of processing methodology used to analyse data and produce final images. (a) How wavelength dependent propagation of light through different cores is accounted for through normalisation of the data with a brightfield image. (b) How spectral ratio values are calculated following a core matching protocol and interpolation.

