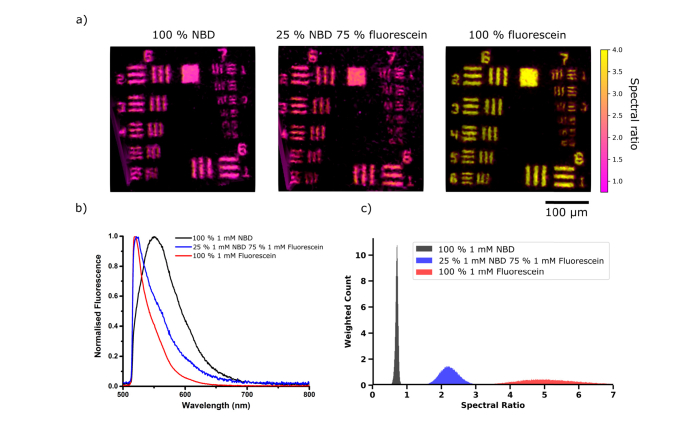
Fig. 5.
(a) Images from negative USAF target with (left to right) 100% 1 mM NBD, 25% 1 mM NBD 75% 1 mM fluorescein, and 100% 1 mM fluorescein with spectral ratio values clipped to 0.75 - 4. (b) Spectra of the three solutions taken at an illumination wavelength of 470 nm at 5.5 µW, using a commercial spectrometer (USB2000 + VIS-NIR-ES, Ocean Optics). (c) Histograms of the spectral ratio values contained within USAF images summed over the whole image for ten sequential frames. The histograms have been weighted by intensity and normalised by area for ease of comparison. Broadening of the 100% fluorescein histogram is due to a low signal to noise ratio above the cut-off wavelength at 605 nm. Note that a shift of the spectra towards shorter wavelengths corresponds to an increase in the spectral ratio calculated.

