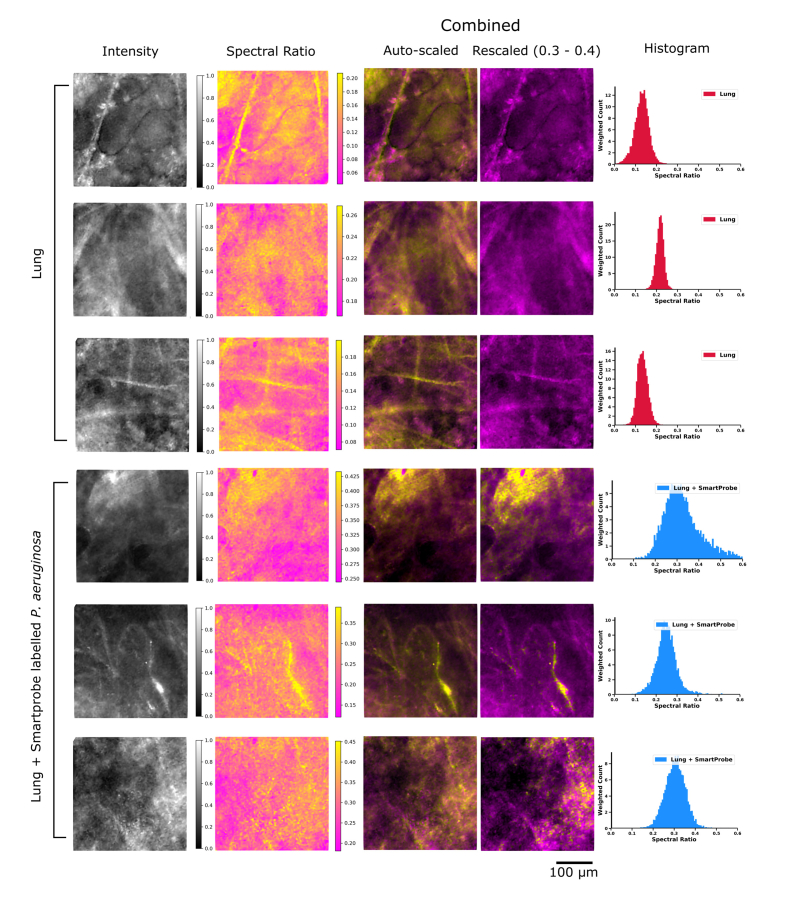
Fig. 6.
(top three rows) Typical examples of imaging lung tissue in an ex vivo lung perfusion (EVLP) model prior to instillation of labelled bacteria. (bottom three rows) Typical examples of EVLP lung imaging after in situ delivery of SmartProbe labelled P. aeruginosa. All images are the same FOV presented in four modes. (from left to right) Intensity image as would appear on a widefield fluorescence fibred OEM system; spectral ratio image (auto-scaled); combined image with auto-scaling; combined image with scaling clipped from a spectral ratio of 0.3 to 0.4 to enhance SmartProbe labelled P. aeruginosa visibility (see Visualization 2 (18.1MB, mp4) ); histograms of the spectral ratio contained with the image. Selected images are shown enlarged in Fig. 7.

