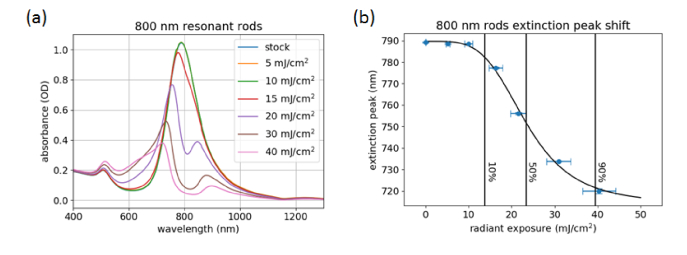
Fig. 3.
Absorbance spectra of the 800-nm resonant nanorods at different radiant exposures (a), and plasmon peak position as a function of radiant exposure (b). The stock, 5 mJ/cm2, and 10 mJ/cm2 spectra in (a) are overlapped, indicating that nanorod shape is stable at these exposure levels. The 10, 50 and 90% lines in (b) correspond to 13.8 ± 0.7, 23 ± 1, and 40 ± 2 mJ/cm2, respectively.

