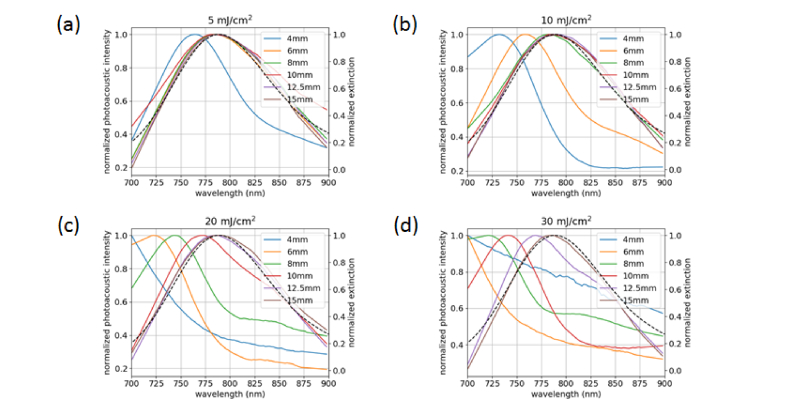
Fig. 4.
(a) Photoacoustic spectra of the nanorod samples after exposure at 5.0 ± 0.5 mJ/cm2 (left axis, colored lines) compared to spectrophotometric data from the stock sample (right axis, dashed black line). (b) Exposure at 10.0 ± 0.9 mJ/cm2. (c) Exposure at 20 ± 2 mJ/cm2. (d) Exposure at 30 ± 1 mJ/cm2.

