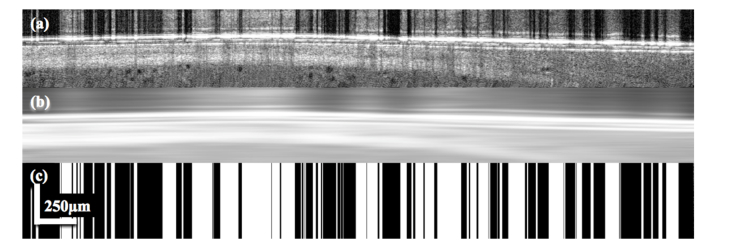
Fig. 6.
(a) Original section of B-scan with high reflection. (b) Section of the same high reflection B-scan following application of a horizontal blurring filter. (c) Binary mask with all white portions representing all A-scans in 6a whose mean intensity value exceeded 15 above the mean intensity value of the corresponding A-scan in 6b. (49% of A-scans in this example qualify as reflection stripes)

