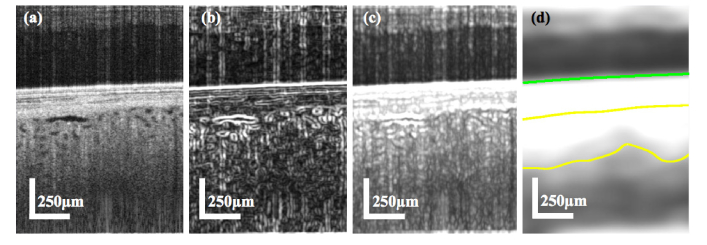
Fig. 10.
(a) Original section of a B-scan. (b) Map of lumen edge strength with brighter regions corresponding to stronger lumen edges. (c) Texture estimate generated by a vertically weighted standard deviation filter and contrast adjustment. (d) Greyscale output of the weighted combination of Fig. 10(a)-(c). The area between the green line and bottom yellow line represents the output of the thresholding of the image. The area between the top yellow line (derived from the capsule-cortex interface segmentation step (section 2.6.4) and the bottom yellow line represents the final segmented area of quantifiable cortex.

