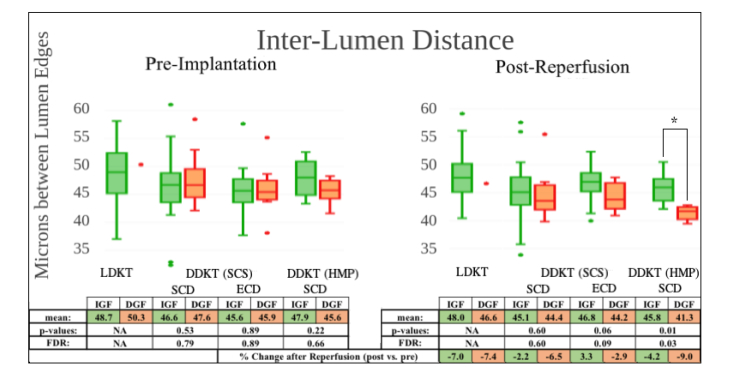
Fig. 20.
Box and whisker plots of inter-lumen measurements for pre-implantation (left) and post-reperfusion (right) scans for the LDKT group (green), and the DDKT subgroups: SCD kidneys stored by SCS, ECD kidneys stored by SCS, and SCD kidneys stored by HMP. Each transplant group is further divided into recovery groups which experienced either IGF (green) or DGF (red) following transplant. Mean inter-lumen distance values for each recovery group are included in the attached table with p-values (from Student’s t-test) and values adjusted for FDR between transplant groups, representing significance of difference between recovery groups for each transplant group. The percent change (increase or decrease) to inter-lumen distance following reperfusion is included at the bottom of each table for both recovery groups in each transplant group.

