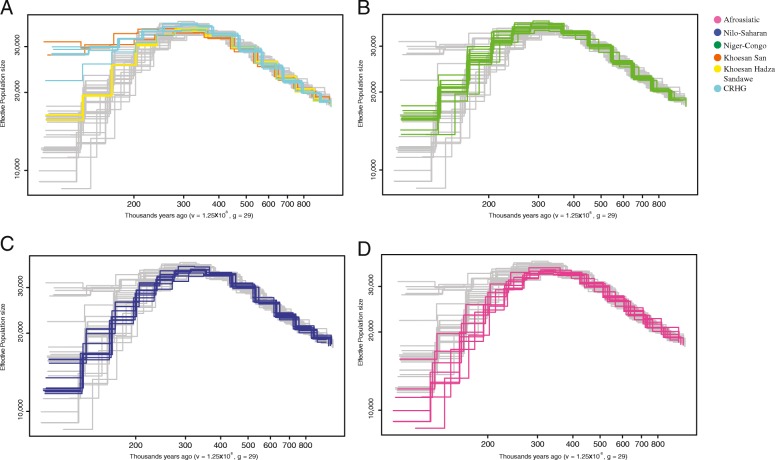
Fig. 5.
Effective population size inferred using MSMC. Each line represents the average effective population size per population, and the colors represent language usage, except for the CRHG populations. Here, we assume a mutation rate per generate (v) 1.25 × 10⁻⁸ and average generation time (g) 29 years. a–d The effective population size of Khoesan-, Niger-Congo-, Nilo-Saharan-, and Afroasiatic-speaking populations

