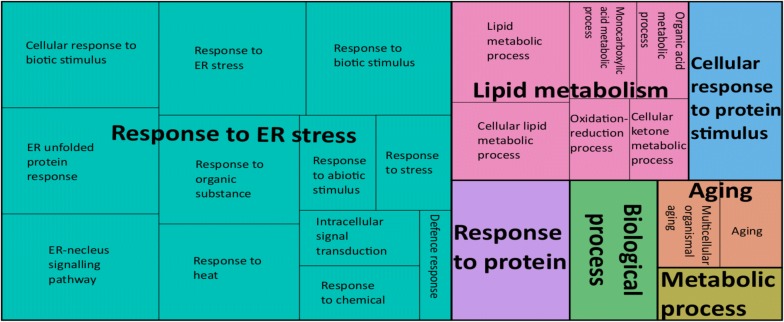
Fig. 1.
A gene ontology (GO) map of 214 upregulated genes in C. elegans in response to treatment with Pf-fraction 5 and linked to conserved biological processes. Individual rectangles represent single gene ontology terms, which are arranged into ‘superclusters’ (related terms), shown in different colors. The size of each rectangle reflects the frequency of individual GO terms representing the upregulated genes

