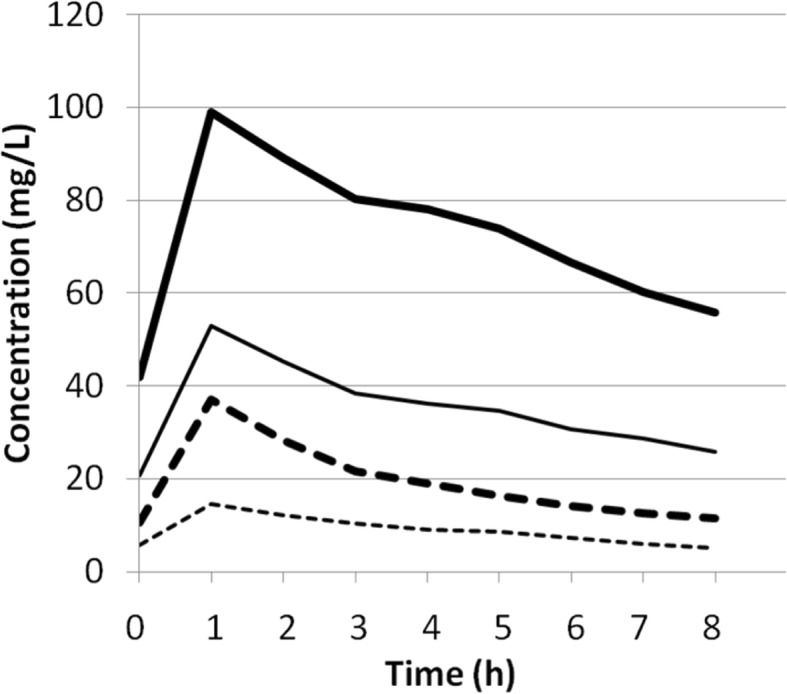
Fig. 1.

Simulated plasma concentrations versus time curves for ceftolozane and tazobactam. Pre-filter (thick line) and post-filter (fine line) ceftolozane plasma concentrations and pre-filter (thick dotted line) and post-filter (fine dotted line) tazobactam plasma concentrations. (The figure is original for this article)
