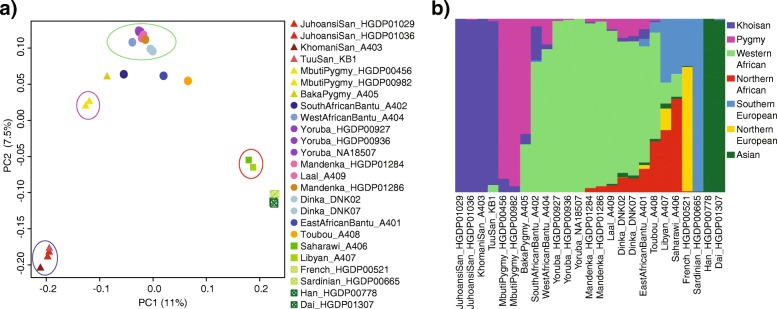
Fig. 2.
Principal component analysis (PCA) and ADMIXTURE. a First two components of a PCA, percentage of explained variance shown in axis; African samples are grouped in four major genetic ancestries, representative samples of each ancestry are shown with a circle colored with its correspondent main genetic ancestry estimated in b, North Africans and African samples not circled might be heavily admixed according to b; b ADMIXTURE plot for the 25 samples in our dataset; the seven ancestries are named according to individuals that have almost exclusively a given ancestry. The plot for the remaining 705 samples is shown in Additional file 1: Figure S6.3

