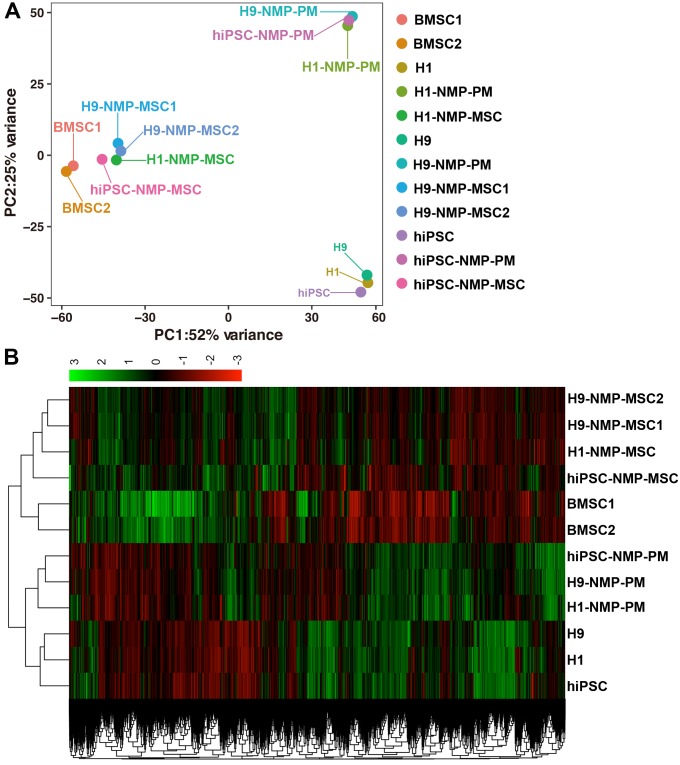
Figure 7.
Principal component analysis and heatmap of transcriptome profiles from hPSC, hPSC-NMP-PM, and NMP-MSC. A. Principal component analysis (PCA) showed that undifferentiated hPSC and hPSC-NMP-PM grouped together, whereas NMP-MSC derived from the various cell lines or control BMSC each represented distinct expression profiles. B. Heat map of global gene expression profiles showed that the cell groups exhibited different gene expression patterns consistent with the results of our PCA.

