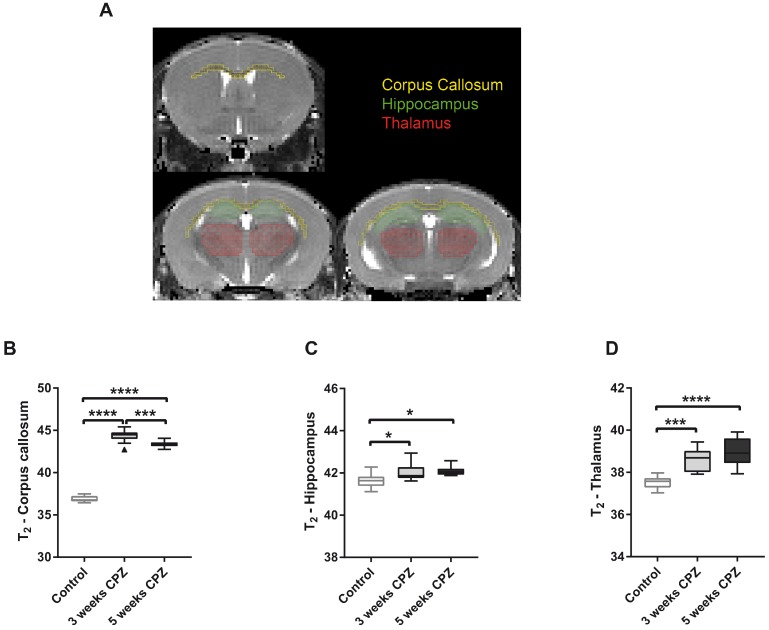
Figure 4.
Quantification of mean T2 values for control, CPZ-treated week 3, and CPZ-treated week 5 groups, in different brain regions (A). T2 values were significantly increased in the (B) CC at 3 weeks of CPZ, compared to control, and decreased at 5 weeks of CPZ, compared to 3 weeks of CPZ. In the (C) HC and the (D) thalamus, both week 3 and 5 of CPZ showed elevated T2 values. (n=10; One way ANOVA followed by Tukey multiple comparisons correction; *p ≤ 0.05, **p≤0.01, ***p ≤ 0.001, ****p≤0.0001). Values are presented as Tukey box plots (mean ± SD). Abbreviations: CPZ, cuprizone.

