Figure 1.
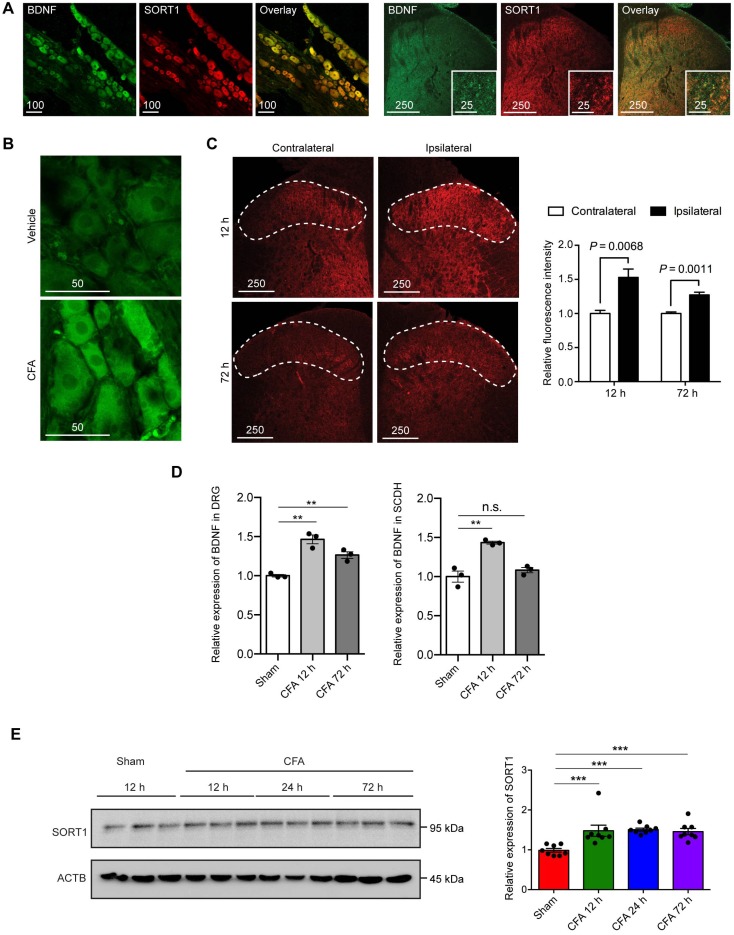
Co-expression of BDNF and sortilin in the primary afferents and their induction in rat model of CFA-induced inflammatory pain. (A) Fluorescence microscopy of BDNF (green) and Sortilin (SORT1) (red). Left, L4-L5 DRGs. Scale bar represents 100 µm. Right, lumbar dorsal horn. Overview and magnification are shown. Scale bars represent 250 µm (overview) and 25 µm (insert). Tissues were extracted from untreated animals. (B) Fluorescence microscopy of BDNF (green) at 12 h after intraplantar injection of vehicle or CFA. (C) Left, fluorescence microscopy of BDNF (red) in lumbar dorsal horn at 12 and 72 h. Dotted line indicates superficial lamina. Right, quantification of fluorescence intensity of superficial layers of lumbar dorsal horn. Values are mean ± SEM; Student's t-test. n = 4. (D) Left, BDNF expression in L4-L5 DRGs measured with ELISA. Right, BDNF expression in dorsal horn of lumbar spinal cord measured with ELISA. Values are mean ± SEM; P=0.0007 for DRG, P=0.0012 for SCDH, one-way ANOVA. n = 3. **P<0.01; n.s., non-significant. DRG, dorsal root ganglion; SCDH, spinal cord dorsal horn. (E) Left, representative immunoblots of ipsilateral L4-L5 DRG tissues of CFA-induced inflammatory pain model obtained with antibodies against sortilin or β-actin. Each lane corresponds to the protein sample extracted from one rat. Right, histogram shows relative sortilin expression normalized to β-actin. Values are mean ± SEM; P=0.004, one-way ANOVA. n = 8. ***P<0.001; Ctrl, Control.

